Standard Engineering Technology Limited reported its highest-ever quarterly and full-year financial performance for Q4FY26 and FY26. The company delivered on its stated guidance, supported by steady execution across core businesses, improved operational efficiencies, and disciplined cost management. For the year ended March 31, 2026, total income stood at Rs 793 crore, registering a 26.7% year-on-year growth, while Profit After Tax (PAT) increased by 20.61% to Rs 83 crore. The statutory auditors, M/s. M S K A and Associates LLP, issued an unmodified opinion on both standalone and consolidated financial statements. The financial results were reviewed by the audit committee and approved by the board of directors at their meeting held on May 14, 2026.
Financial Performance
The company reported robust growth across key financial metrics for both the quarter and the full year. In Q4FY26, total income reached Rs 231 crore, a 35.0% increase from the previous year. EBITDA for the quarter rose 26.0% year-on-year to Rs 36 crore, with an EBITDA margin of 15.5%. PAT for the quarter stood at Rs 21 crore, up 26.33% year-on-year. The EBITDA for the full year was Rs 138 crore, up 15.22% year-on-year, with a margin of 17.4%. The investor presentation further highlighted a 35% total revenue CAGR and a 35% EBITDA CAGR over FY22–26, with the company maintaining a net debt-free status and healthy cash of Rs 185 crore in its books.
The following table presents the key consolidated financial metrics for Q4FY26 and FY26, along with year-on-year and quarter-on-quarter comparisons:
| Metric: |
Q4FY26 |
Q3FY26 |
QoQ |
Q4FY25 |
YoY |
FY26 |
FY25 |
YoY |
| Revenue from Operations (Rs. Cr) |
226.7 |
191.6 |
18.3% |
166.3 |
36.3% |
774.1 |
613.7 |
26.1% |
| Other Income (Rs. Cr) |
4.2 |
4.3 |
-2.4% |
4.7 |
-10.6% |
19.0 |
12.3 |
54.5% |
| Total Income (Rs. Cr) |
230.9 |
195.9 |
17.9% |
171.0 |
35.0% |
793.1 |
626.0 |
26.7% |
| Total Expenditure (Rs. Cr) |
195.1 |
162.3 |
20.2% |
142.7 |
36.8% |
655.1 |
506.2 |
29.4% |
| EBITDA Margin (%) |
15.5% |
17.1% |
-165 bps |
16.6% |
-110 bps |
17.4% |
19.1% |
-173 bps |
| Depreciation (Rs. Cr) |
4.4 |
4.1 |
7.3% |
3.5 |
25.7% |
16.0 |
11.1 |
44.1% |
| Interest (Rs. Cr) |
2.8 |
2.9 |
-3.4% |
2.6 |
7.69% |
10.7 |
15.1 |
-29.14% |
| Tax (Rs. Cr) |
7.5 |
6.1 |
22.9% |
5.7 |
31.6% |
28.2 |
24.9 |
13.1% |
| PAT Margin (%) |
9.1% |
10.4% |
-128 bps |
9.6% |
-51 bps |
10.5% |
11.0% |
-50 bps |
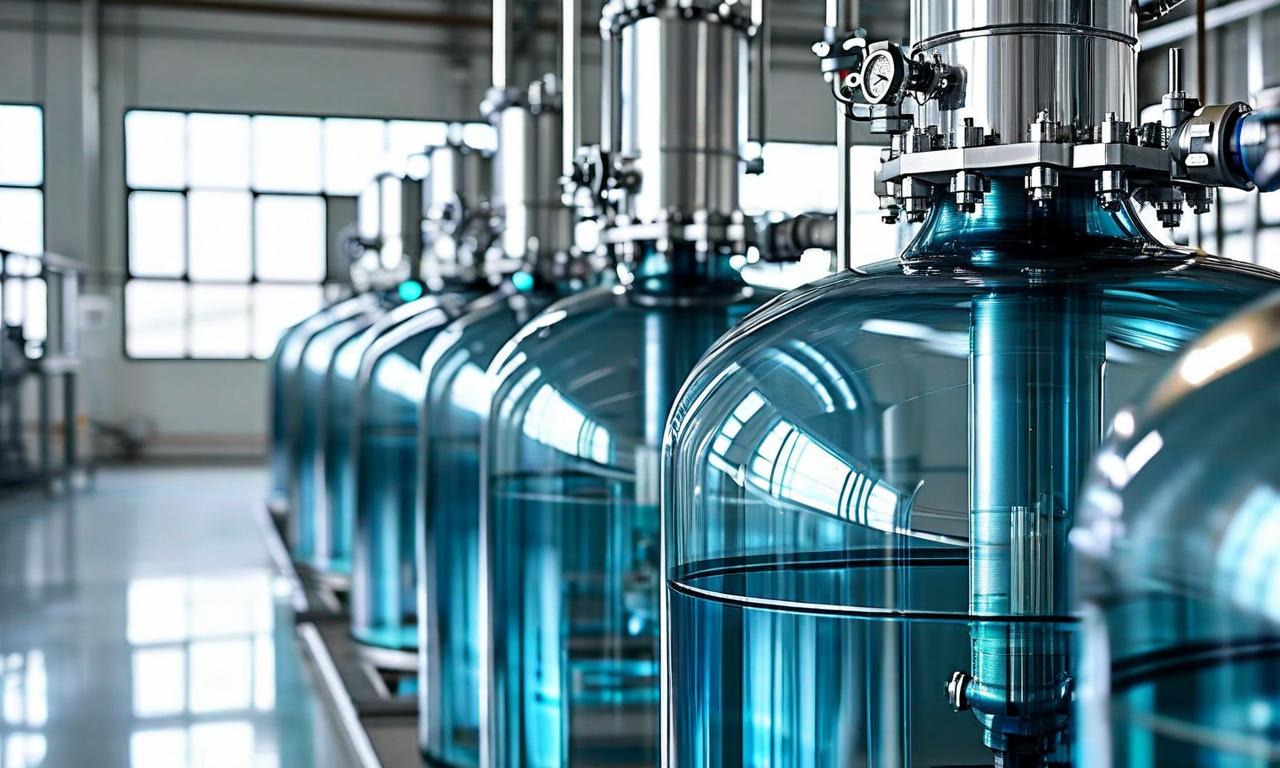
On a consolidated basis for FY26, revenue from operations rose to Rs 77,409.99 Lakhs from Rs 61,366.13 Lakhs in the prior year. Total income, including other income of Rs 1,899.17 Lakhs, stood at Rs 79,309.16 Lakhs. Profit before tax for the full year was Rs 11,120.27 Lakhs, while net profit was Rs 8,303.97 Lakhs. On a standalone basis, revenue from operations for FY26 stood at Rs 25,866.52 Lakhs compared to Rs 19,631.32 Lakhs in the prior year. Standalone profit before tax was Rs 5,293.02 Lakhs and net profit was Rs 4,108.72 Lakhs. Basic and diluted earnings per share (standalone) for FY26 stood at Rs 2.06, compared to Rs 1.54 in the prior year. On a consolidated basis, basic and diluted EPS for FY26 were Rs 4.01, up from Rs 3.47 in the prior year.
The multi-year consolidated income statement is presented below:
| Particulars (Rs. Cr): |
FY23 |
FY24 |
FY25 |
FY26 |
| Revenue from Operations |
497.6 |
543.7 |
613.7 |
774.1 |
| Other Income |
2.5 |
6.0 |
12.3 |
19.0 |
| Total Income |
500.1 |
549.7 |
626.0 |
793.1 |
| COGS |
285.5 |
317.7 |
344.3 |
414.7 |
| Total Expenditure |
411.8 |
448.8 |
506.2 |
655.1 |
| EBITDA Margins (%) |
17.6% |
18.4% |
19.1% |
17.4% |
| Depreciation |
7.7 |
9.3 |
11.1 |
16.0 |
| Interest |
8.7 |
11.8 |
15.1 |
10.7 |
| Tax |
18.4 |
19.8 |
24.9 |
28.2 |
| Diluted EPS (Rs.) |
3.5 |
3.5 |
3.5 |
4.0 |
Segment Performance
The group operates across three reportable segments. Revenue growth was primarily driven by expansion of the product portfolio. EBITDA margin declined mainly on account of an increase in employee benefit expenses and other expenses, with the same factors also weighing on PAT margin. The following table summarises segment revenue and profit before tax and interest for FY26 and Q4FY26:
| Segment: |
FY26 Revenue (Rs. Lakhs) |
FY26 Segment Profit (Rs. Lakhs) |
Q4FY26 Revenue (Rs. Lakhs) |
Q4FY26 Segment Profit (Rs. Lakhs) |
| Glass Lined Equipment Solutions |
25,866.52 |
5,664.00 |
7,821.98 |
1,215.69 |
| Metal Equipment and Pumps Solutions |
51,986.97 |
7,132.15 |
14,947.51 |
1,984.54 |
| PTFE Lined Pipes & Fittings |
3,834.18 |
633.57 |
1,231.45 |
249.71 |
Balance Sheet Highlights
The company's consolidated balance sheet reflects significant growth in both assets and equity over the period. The following tables summarise key balance sheet items:
| Particulars (Rs. Cr): |
FY23 |
FY24 |
FY25 |
FY26 |
| Equity Share Capital |
15.8 |
18.2 |
199.5 |
199.5 |
| Other Equity |
139.9 |
389.2 |
507.3 |
589.3 |
| Non-Controlling Interests |
— |
1.6 |
5.9 |
8.9 |
| Total Equity |
155.7 |
409.0 |
712.7 |
797.7 |
| Total Non-Current Liabilities |
24.2 |
14.5 |
26.9 |
31.2 |
| Total Current Liabilities |
167.9 |
241.9 |
218.7 |
424.9 |
| Total Equity and Liabilities |
347.8 |
665.4 |
958.4 |
1,253.8 |
| Total Non-Current Assets |
84.7 |
106.6 |
160.3 |
235.4 |
| Inventories |
143.4 |
224.8 |
279.3 |
438.0 |
| Trade Receivables |
91.3 |
154.8 |
214.0 |
255.5 |
| Cash and Cash Equivalents |
5.4 |
15.4 |
1.7 |
7.3 |
| Total Current Assets |
263.1 |
558.8 |
798.1 |
1,018.4 |
| Total Assets |
347.8 |
665.4 |
958.4 |
1,253.8 |
Strategic Developments
During FY26, the company took significant steps to strengthen its board and global leadership capabilities. The Board approved the re-designation of Mr. Yasuyuki Ikeda from Non-Executive Director to Executive Director for a term of five years effective May 14, 2026, subject to shareholder approval. He will lead global operations and marketing initiatives, focusing on expanding the company's international customer base and strengthening India's presence while facilitating access to advanced technology from Japan and overseas. Mr. Ikeda has been a board member since March 2023, is associated with the AGI Group, Japan, and holds a diploma from TASIS, Thorpe, Surrey, England.
The Board also appointed Mr. Kancherla Uma Maheswara Rao as an Independent Director for a term of five years effective May 14, 2026, subject to shareholder approval. Mr. Rao holds a B. Tech in Mechanical Engineering from JNTU College of Engineering and an M. Tech from IIT Madras, and brings over 38 years of experience in precision engineering, industrial manufacturing, and software product development. He holds 22,500 equity shares in the company. Additionally, the Board approved the re-appointment of M/s. KY & Co., Chartered Accountants as the Internal Auditors of the company for the financial year 2026-27.
Business Expansion
The company incorporated Standard Projects Private Limited as a 75% subsidiary to strengthen capabilities in civil construction, precast infrastructure, and pre-engineered building (PEB) capabilities in India and overseas, with a focus on turnkey execution of industrial and infrastructure projects. It also entered into a Target-Based Conditional Distribution Agreement with API Pharma Pharmaceutical Trading L.L.C., UAE for the Middle East region, covering exports across pharmaceutical, biopharmaceutical, life sciences, food and beverage, and process industries, with an initial three-year performance period extendable up to ten years.
The company completed the acquisition of Standard C2C Engineering Private Limited on November 19, 2025, purchasing 51% equity shareholding for Rs 1,224.00 lakhs, with an obligation to undertake a mandatory buyout of the remaining 49% at a minimum price of Rs 1,176.00 lakhs upon completion of six years from the date of the agreement. An additional investment of Rs 408.00 lakhs was made on January 21, 2026. The company also subscribed to 51% equity shares in Standard Scigenics Private Limited for Rs 0.51 lakhs, which subsequently acquired the manufacturing business of Scigenics India Private Limited for Rs 900.00 lakhs through a Business Transfer Agreement. The investor presentation also highlighted a planned capex of Rs 130 crore over the next two years, targeting a total expansion of 5.5 lakh sq. ft. of manufacturing capacity.
IPO Proceeds Utilisation
The company completed its IPO of 2,92,89,367 equity shares at an issue price of Rs 140 per share, with equity shares listed on BSE and NSE on January 13, 2025. The following table summarises the utilisation of net IPO proceeds as at March 31, 2026:
| Object of Issue: |
Amount to be Utilised (Rs. Lakhs) |
Utilised up to March 31, 2026 (Rs. Lakhs) |
Unutilised (Rs. Lakhs) |
| Capital expenditure of the Company |
1,000.00 |
771.94 |
228.06 |
| Repayment of borrowings |
13,000.00 |
13,000.00 |
— |
| Capital expenditure in S2 Engineering Industry Pvt. Ltd. |
3,000.00 |
1,086.25 |
1,913.75 |
| Inorganic growth/acquisitions |
2,000.00 |
2,000.00 |
— |
| General corporate purposes |
4,224.50 |
1,703.23 |
2,521.27 |
| Total |
23,224.50 |
18,561.42 |
4,663.08 |
Unutilised net proceeds as at March 31, 2026 were temporarily invested in deposits with scheduled commercial banks.
Regulatory Compliance
In compliance with Regulation 47 of the SEBI (Listing Obligations and Disclosure Requirements) Regulations, 2015, Standard Engineering Technology Limited submitted copies of newspaper advertisements for its audited financial results for the fourth quarter and year ended March 31, 2026 to the Listing Compliance Departments of BSE Limited and National Stock Exchange of India Limited on May 15, 2026. The advertisements were published in both English and Telugu newspapers. The full format of the financial results is available on the stock exchange websites and the company's website.


 19
19





 Access 50+ Readymade Screeners
  Use 200+ Custom Filters
  Get Full Market Insights





