

Solarworld Energy FY26 Results: Revenue surges 157% YoY to ₹14,160.66 million


- Consolidated total income rose 157% YoY to ₹14,160.66 million in FY26, with revenue from operations up 152.61% to ₹13,761.56 million
- PAT grew 56.36% to ₹1,204.74 million; EBITDA rose 62.62% to ₹1,879.26 million, though margins contracted
- Order book expanded to ₹28,130.42 million as of March 31, 2026, including ₹5,990 million in BESS EPC wins from NTPC
- 1.552 GW TOPCon solar module manufacturing facility commissioned in Roorkee; 3.4 GW BESS manufacturing facility also operational
- CRISIL upgraded long-term credit rating to A-/Stable; company proposes to redirect ₹4,200 million IPO proceeds to a 2.4 GW solar cell JV plant

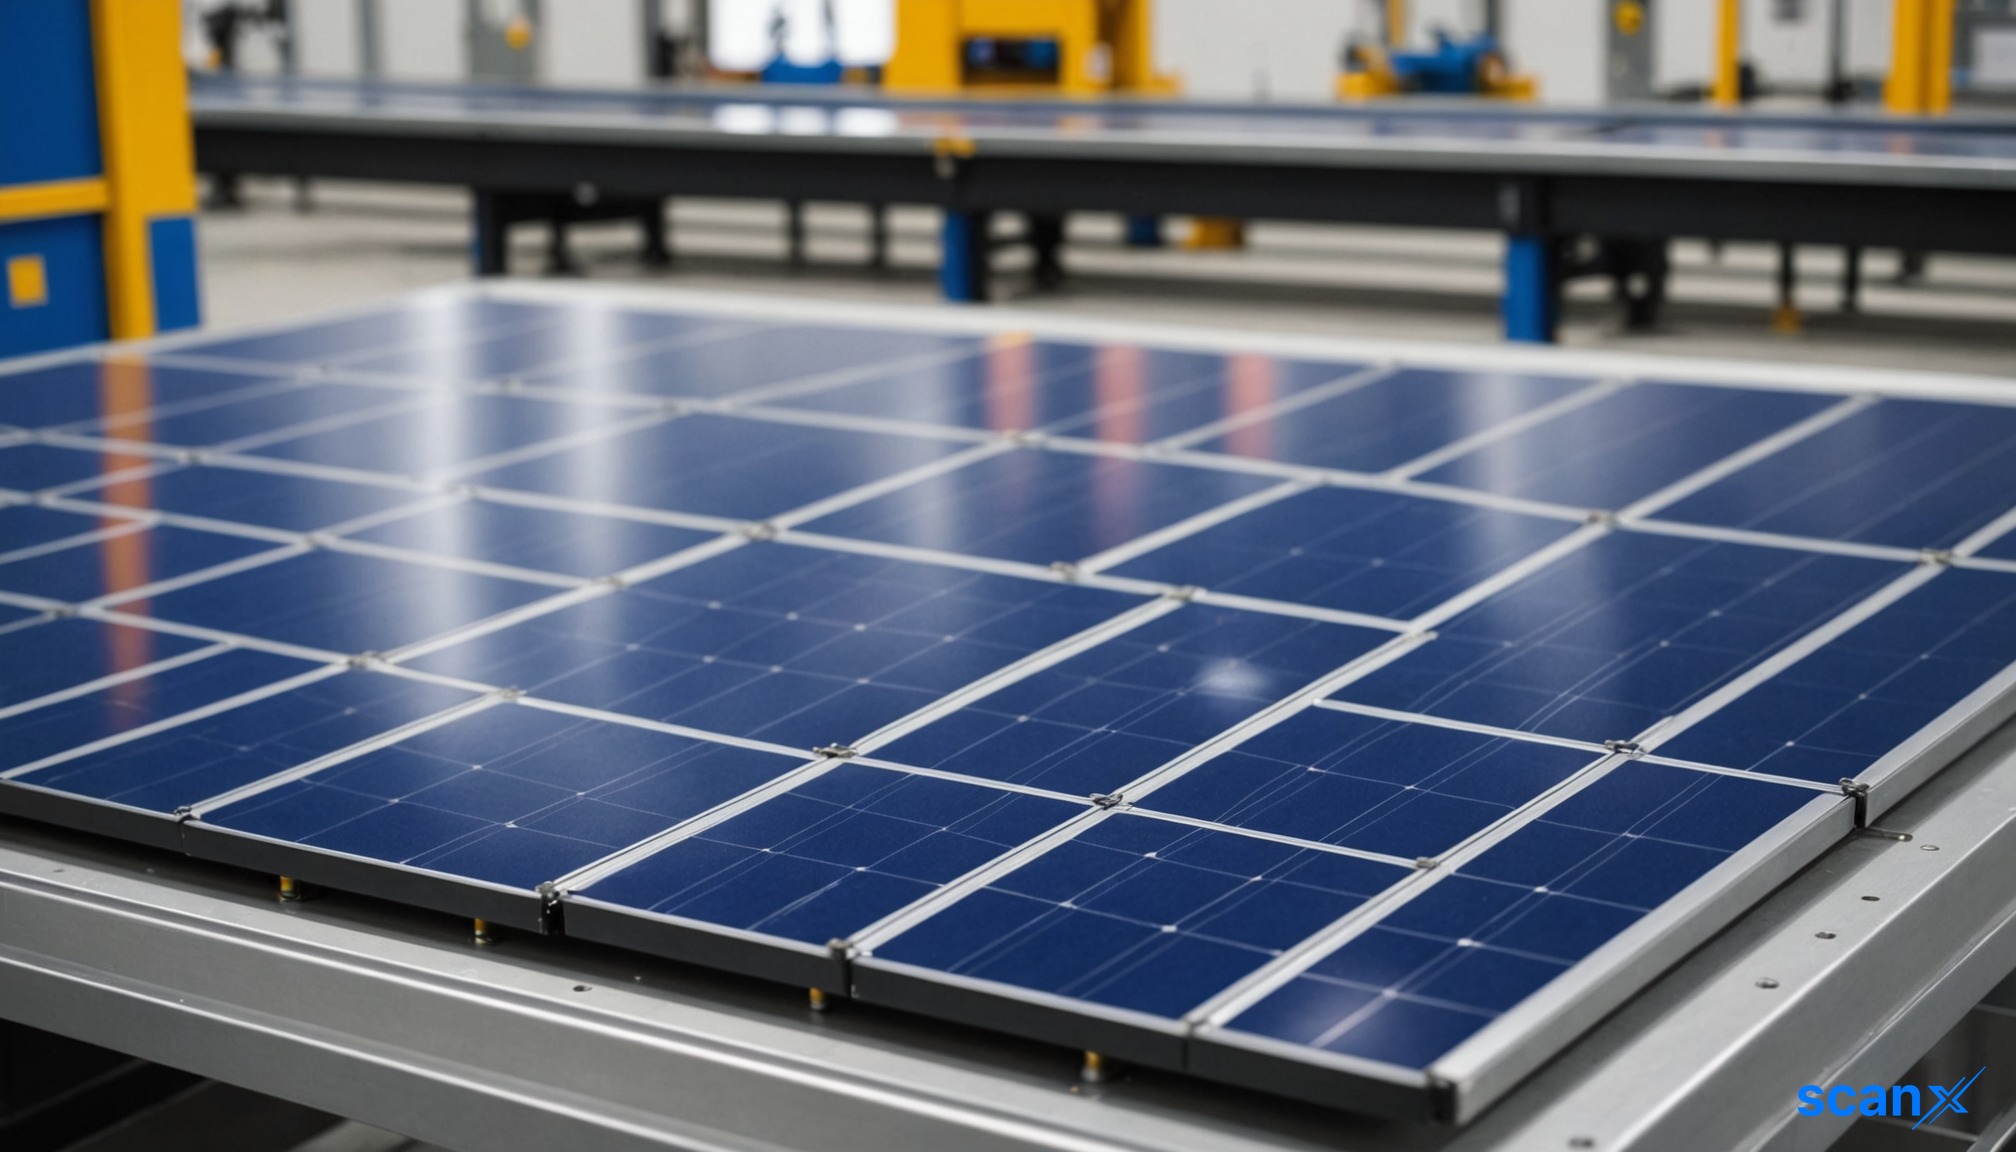

*this image is generated using AI for illustrative purposes only.
Solarworld Energy Solutions reported consolidated total income of ₹14,160.66 million for FY26, a 157% year-on-year jump, with profit after tax rising 56.36% to ₹1,204.74 million.
Financial Performance Overview
The company's consolidated revenue from operations reached ₹13,761.56 million in FY26, compared to ₹5,447.65 million in FY25, representing growth of 152.61%. EBITDA stood at ₹1,879.26 million against ₹1,155.67 million in the prior year, while the EBITDA margin moderated to 13.66% from 21.21%. The debt-to-equity ratio improved to 0.30x from 0.37x, and net worth stood at ₹8,477.97 million as of March 31, 2026.
Key Financial Metrics
| Metric | FY26 | FY25 | YoY Change |
|---|---|---|---|
| Total Income (₹ Mn) | 14,160.66 | 5,510.85 | +157% |
| Revenue from Operations (₹ Mn) | 13,761.56 | 5,447.65 | +152.61% |
| EBITDA (₹ Mn) | 1,879.26 | 1,155.67 | +62.62% |
| EBITDA Margin (%) | 13.66 | 21.21 | -755 bps |
| PAT (₹ Mn) | 1,204.74 | 770.48 | +56.36% |
| PAT Margin (%) | 8.75 | 14.14 | -539 bps |
| Debt/Equity Ratio | 0.30 | 0.37 | -18.92% |
| ROCE (%) | 34.26 | 54.53 | — |
| ROE (%) | 20.83 | 40.27 | — |
Revenue Breakdown
EPC revenue grew 143.45% to ₹11,635.12 million from ₹4,779.33 million in FY25, driven by execution of projects aggregating 742 MW DC. Product sales rose 216.73% to ₹1,933.64 million, primarily from the commencement of solar panel sales at the newly commissioned module manufacturing facility operated by wholly owned subsidiary ZNSHINE Solarworld Private Limited. Services and O&M revenue increased 228.66% to ₹187.24 million, with O&M coverage expanding to six projects aggregating 321 MW DC.
| Revenue Segment | FY26 (₹ Mn) | FY25 (₹ Mn) | YoY Growth |
|---|---|---|---|
| EPC Revenue | 11,635.12 | 4,779.33 | +143.45% |
| Product Sales | 1,933.64 | 610.50 | +216.73% |
| Services/O&M | 187.24 | 56.97 | +228.66% |
| Scrap Sale | 5.56 | 0.85 | +554.63% |
| Total Revenue | 13,761.56 | 5,447.65 | +152.62% |
Order Book and Operational Metrics
The consolidated order book expanded to ₹28,130.42 million as of March 31, 2026, from ₹17,005.51 million at the end of FY25. The order book comprises ₹16,740 million from solar EPC and O&M projects and ₹11,390 million from EPC and BESS IPP-related projects. Notable order wins during the year included BESS EPC orders worth ₹5,990 million for NTPC's Solapur and Unchahar thermal power station projects, and a ₹2,350 million Balance of System order from NTPC Renewable Energy for a 260 MW solar project in Bikaner.
| Operational Metric | FY26 | FY25 |
|---|---|---|
| Order Book (₹ Mn) | 28,130.42 | 17,005.51 |
| Contracted Capacity | 853 MW DC EPC + 457 MW/914 MWh BESS | 376 MW DC EPC + 125 MW/250 MWh BESS |
| Ongoing Solar EPC Capacity | 1,809 MW DC | — |
| Ongoing BESS Capacity | 1,164 MWh | — |
| Completed Projects (Cumulative) | 47 projects | 46 projects |
| O&M Served | 323 MW DC | 299 MW DC |
Manufacturing and Expansion Highlights
During FY26, the company commissioned a 1.552 GW ALMM-approved TOPCon solar module manufacturing facility in Roorkee, Uttarakhand, producing high-efficiency modules of 600W–750W across M10R, G12R and G12 formats. A 3.4 GW automated BESS manufacturing facility, built with KUKA robotics, and a 5 GW junction box manufacturing line further deepened backward integration. A 2.4 GW solar cell manufacturing facility is under development through a proposed joint venture with Rays Power Infra Limited, targeted for commissioning by June 2027.
Capital Structure and Credit Profile
Total equity stood at ₹8,477.97 million as of March 31, 2026, up from ₹3,090.66 million in FY25, reflecting capital infusion from the IPO completed on September 30, 2025. Total borrowings increased to ₹2,554.59 million from ₹1,145.54 million. During FY26, CRISIL Ratings revised the company's long-term credit rating to CRISIL A-/Stable and non-fund based facilities to CRISIL A2+. The company's 13th Annual General Meeting is scheduled for September 30, 2026, through video conferencing.
IPO Proceeds Utilisation
The company raised total proceeds of ₹5,500 million through its IPO and pre-IPO placement. As of March 31, 2026, ₹1,016.58 million was utilised towards general corporate purposes, while ₹4,200.00 million earmarked for investment in subsidiary Kartik Solarworld Private Limited for the Pandhurana Project remained unutilised and temporarily invested in fixed deposits. The company is seeking shareholder approval to redirect these proceeds to a 2.4 GW solar cell manufacturing plant through the joint venture with Rays Power Infra Limited, at an estimated project cost of ₹10,000 million.
| IPO Object | Amount to be Utilised (₹ Mn) | Utilised as of March 31, 2026 (₹ Mn) | Unutilised (₹ Mn) |
|---|---|---|---|
| Investment in KSPL (Pandhurana Project) | 4,200.00 | — | 4,200.00 |
| General Corporate Purpose | 1,016.78 | 1,016.58 | 0.20 |
| Total | 5,216.78 | 1,016.58 | 4,200.20 |
Historical Stock Returns for Solarworld Energy Solutions
| 1 Day | 5 Days | 1 Month | 6 Months | 1 Year | 5 Years |
|---|---|---|---|---|---|
| -2.89% | -9.36% | -15.60% | -12.25% | -61.19% | -61.19% |

How will the proposed diversion of ₹4,200 million in IPO proceeds to the Rays Power Infra JV impact the timeline and financial viability of the originally planned Pandhurana Project?
Given the significant moderation in EBITDA margins from 21.21% to 13.66%, what specific cost pressures or competitive dynamics are expected to persist in FY27 as EPC volumes scale?
Will the upcoming 2.4 GW solar cell manufacturing facility enable Solarworld to achieve full vertical integration, or will it remain dependent on external suppliers for key components?
 15
15









 Access 50+ Readymade Screeners
  Use 200+ Custom Filters
  Get Full Market Insights





