

Sigachi Industries Q1FY27 PAT up 8% QoQ to ₹82 million


Sigachi Industries reported Q1FY27 PAT of ₹82 million, up 7.89% QoQ, aided by lower finance costs and no exceptional items. EBITDA fell 31.5% YoY to ₹165 million as revenue dropped 5.4% to ₹1,213 million. API segment contribution rose to 15% from 7% YoY.


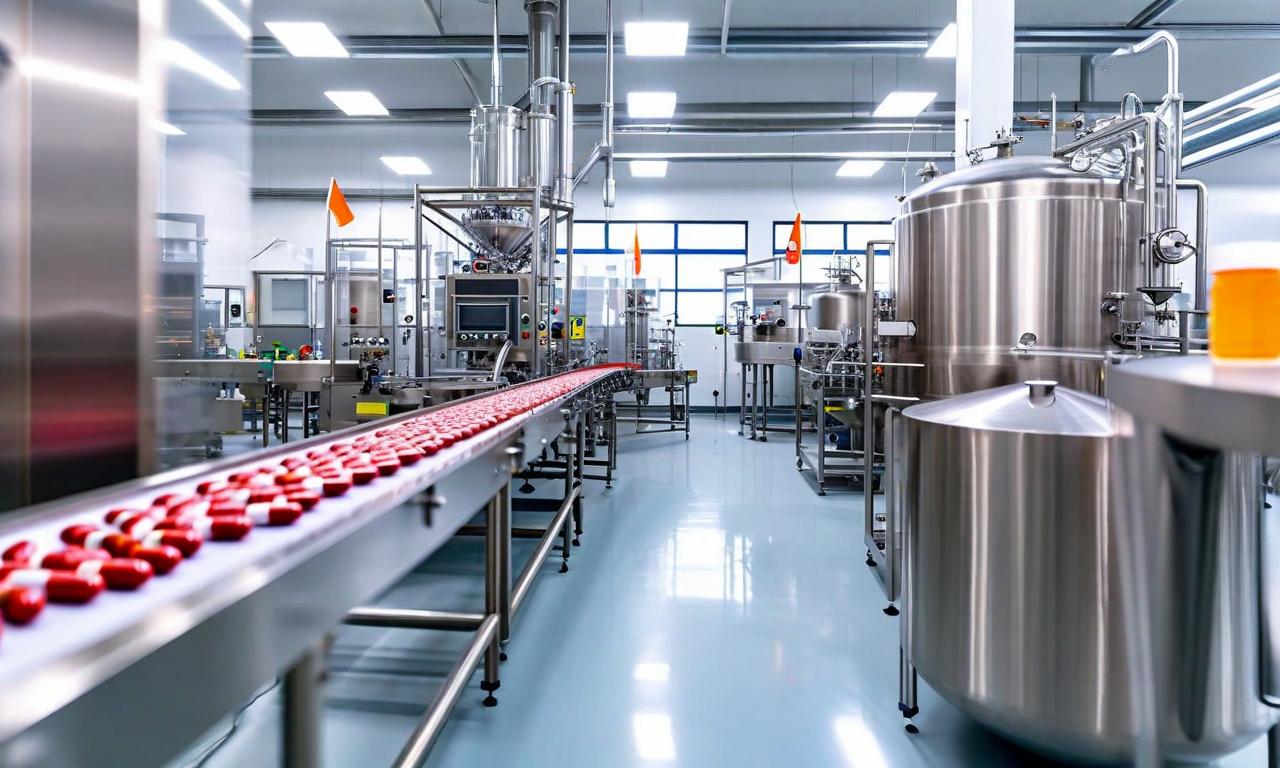
*this image is generated using AI for illustrative purposes only.
Sigachi Industries reported a consolidated net profit (PAT) of ₹82 million for the first quarter of fiscal 2027 (Q1FY27), marking a 7.89% increase quarter-on-quarter from ₹76 million in Q4FY26. The company’s earnings before interest, taxes, depreciation, and amortization (EBITDA) stood at ₹165 million, down 31.53% year-on-year from ₹241 million in Q1FY26. Revenue from operations contracted 5.38% YoY to ₹1,213 million, compared to ₹1,282 million in the prior year period.
The improvement in PAT was primarily driven by a significant reduction in finance costs and the absence of exceptional items that weighed on results in the previous year. Finance costs decreased to ₹30 million in Q1FY27 from ₹33 million in Q1FY26 and ₹43 million in Q4FY26. In contrast, Q1FY26 included exceptional items of ₹1,210 million, which resulted in a net loss of ₹1,010 million for that period. Other income also declined to ₹10 million from ₹39 million in Q1FY26.
Financial Performance Breakdown
| Metric | Q1FY27 | Q1FY26 | YoY Change | Q4FY26 | QoQ Change |
|---|---|---|---|---|---|
| Revenue from Operations | ₹1,213 million | ₹1,282 million | (5.38)% | ₹1,219 million | (0.49)% |
| Total Expenses | ₹1,048 million | ₹1,041 million | 0.67% | ₹1,055 million | (0.66)% |
| EBITDA | ₹165 million | ₹241 million | (31.53)% | ₹154 million | 7.14% |
| EBITDA Margin | 13.60% | 18.79% | (519) bps | 12.63% | 97 bps |
| Profit Before Tax | ₹101 million | (₹1,010) million | - | ₹77 million | 31.17% |
| Net Profit (PAT) | ₹82 million | (₹1,010) million | - | ₹76 million | 7.89% |
EBITDA margin narrowed to 13.60% in Q1FY27, down 519 basis points from 18.79% in Q1FY26 but up 97 basis points sequentially from 12.63% in Q4FY26. The profit before tax margin before exceptional items stood at 8.33%, compared to 15.60% in Q1FY26.
Segment Revenue Contribution
The revenue mix shifted slightly during the quarter, with Microcrystalline Cellulose (MCC) contributing 68% of total revenue, down from 80% in Q1FY26. The Active Pharmaceutical Ingredients (API) segment saw its contribution rise to 15% from 7%, while Allied Trades increased to 6% from 3%. Operations and Management contributed 11%, up from 10%.
Conference Call Details
The company has scheduled its earnings conference call to discuss these results on Thursday, August 13, 2026, at 4:30 pm IST. This date follows a postponement announced on July 26, 2026, with the new schedule confirmed via submission to the National Stock Exchange of India Limited and BSE Limited on August 07, 2026.
The teleconference will be hosted by Go India Advisors. Key management participants include Mr. Amit Raj Sinha, Managing Director & CEO; Mr. O. Subbarami Reddy, Chief Financial Officer; and Mr. Vivek Kumar, Company Secretary & Compliance Officer. Investors are required to pre-register using a Diamond Pass to join the session.
| Detail | Information |
|---|---|
| Date | August 13, 2026 |
| Time | 4:30 pm IST |
| Host | Go India Advisors |
| Dial-In Numbers | +91 22 6280 1557 / +91 22 7115 8383 |
| Registration | Pre-registration required via Diamond Pass |
Participants should dial in five to ten minutes before the start time. For assistance, attendees may contact Priya Sen, Aadith V, or Riddhi Shah at Go India Advisors.
What the Numbers Show
The divergence between the sharp decline in EBITDA and the swing to net profit highlights a significant improvement in non-operating factors or tax efficiency compared to the prior year. While operational margins compressed by over 500 basis points (from 18.79% to 13.61%), the bottom line moved from a substantial loss of ₹1,010 million to a profit of ₹82 million. This suggests that the prior year’s loss was largely driven by exceptional items of ₹1,210 million, which have normalized in the current quarter. Additionally, the reduction in finance costs from ₹33 million to ₹30 million YoY supported the bottom-line recovery despite the contraction in operating profits.
Historical Stock Returns for Sigachi Industries
| 1 Day | 5 Days | 1 Month | 6 Months | 1 Year | 5 Years |
|---|---|---|---|---|---|
| -1.60% | -9.57% | -14.54% | +67.49% | -26.77% | -52.65% |

What specific operational strategies is Sigachi Industries implementing to reverse the 519 bps compression in EBITDA margins and restore profitability in the core MCC segment?
How does management plan to sustain the growth momentum in the API segment, which saw its revenue contribution double to 15%, amidst current global pharmaceutical supply chain dynamics?
Given the 5.38% YoY revenue contraction, what are the company's outlook and pricing power expectations for Microcrystalline Cellulose in Q2FY27?
 16
16








 Access Market Heat-map & Insights
  Create, Save & Share your Screener
  Use 200+ Screening Filters





