

Sanathan Textiles Q1 Results: Consolidated revenue surges 79% YoY


Sanathan Textiles reported Q1FY27 consolidated revenue of ₹1,334.74 crore, up 79.08% YoY, driven by price hikes and Punjab plant ramp-up. Standalone PAT rose 37.64% to ₹64.95 crore. Management maintains FY27 EBITDA guidance of ₹520-540 crore.


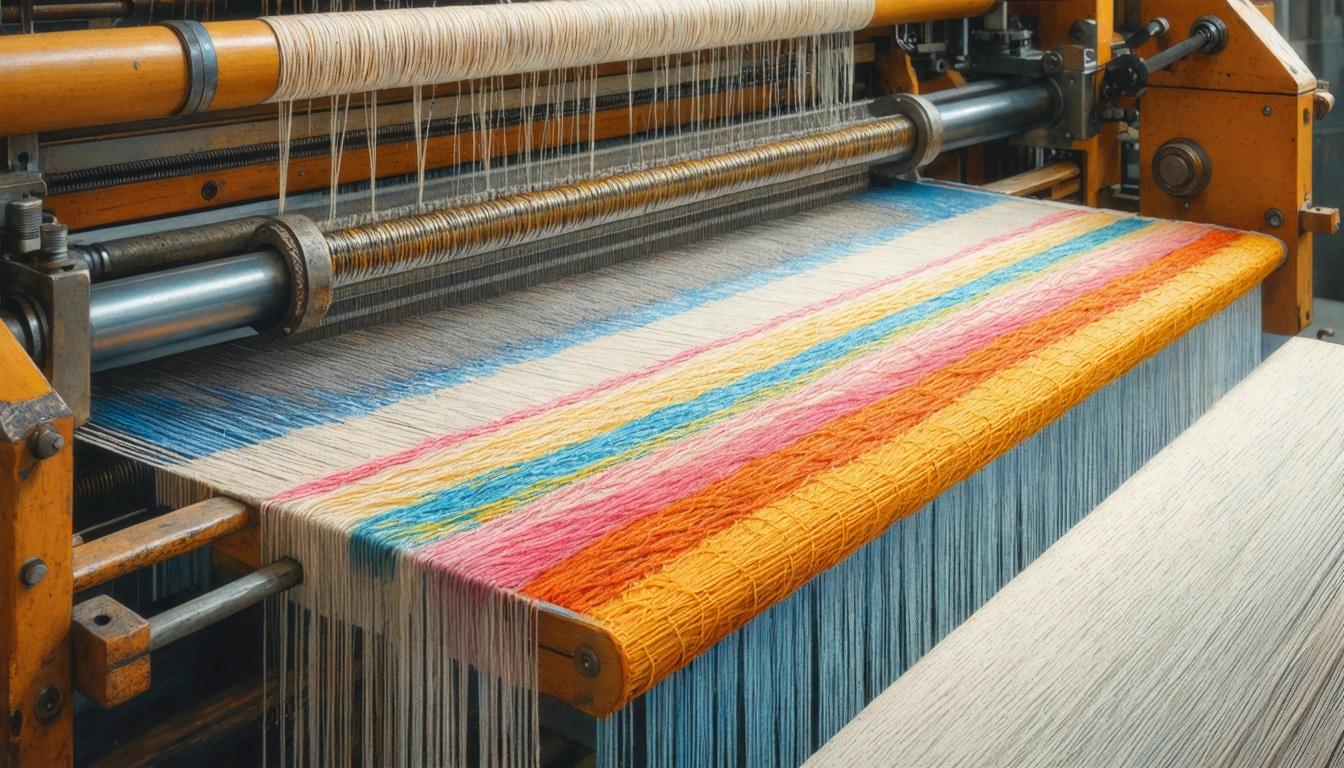
*this image is generated using AI for illustrative purposes only.
Sanathan Textiles Limited reported a robust start to FY27, with consolidated revenue from operations jumping 79.08% year-on-year to ₹1,334.74 crore in the quarter ended June 30, 2026. The significant growth was primarily driven by higher selling prices across yarn verticals and the initial contribution from its newly commissioned Punjab facility. Consolidated EBITDA expanded 55.38% to ₹108.08 crore, while standalone profit after tax (PAT) surged 37.64% to ₹64.95 crore, reflecting improved operational efficiency and disciplined raw material procurement amidst global supply chain disruptions.
The company submitted the earnings call transcript pursuant to Regulation 30 of the SEBI (Listing Obligations and Disclosure Requirements) Regulations, 2015. The results were discussed during an investor conference call held on August 04, 2026, attended by Chairman and Managing Director Paresh Dattani, Executive Director Sammir Dattani, and Chief Financial Officer Sanjay Shah.
Financial Performance Highlights
| Metric | Q1FY27 | Q1FY26 | YoY Change |
|---|---|---|---|
| Consolidated Revenue | ₹1,334.74 crore | ₹745.34 crore | +79.08% |
| Consolidated EBITDA | ₹108.08 crore | ₹69.56 crore | +55.38% |
| Consolidated PAT | ₹23.82 crore | ₹40.43 crore | -41.08% |
| Standalone Revenue | ₹813.13 crore | ₹749.88 crore | +8.43% |
| Standalone EBITDA | ₹94.93 crore | ₹70.05 crore | +35.52% |
| Standalone PAT | ₹64.95 crore | ₹47.19 crore | +37.64% |
While top-line growth was strong, consolidated PAT declined 41.08% year-on-year to ₹23.82 crore due to higher depreciation and finance costs associated with the Punjab plant, which was under construction in the prior year period. Standalone performance remained resilient, with EBITDA margin expanding by 233 basis points to 11.67%.
Operational Updates and Capacity Expansion
The Punjab facility achieved approximately 80% capacity utilization in Q1FY27, contributing significantly to the consolidated volume of 1 lakh metric tons sold. Management expects utilization to rise to 85-90% in Q2FY27 and reach full capacity by subsequent quarters. At Silvassa, technical textile capacity has been expanded from 9,000 metric tons per annum to 18,000 metric tons per annum, with commercial production expected shortly.
Paresh Dattani highlighted that both facilities operated without interruption despite geopolitical tensions affecting PTA and MEG feedstock markets. The government’s temporary waiver of the 11% customs duty on raw cotton imports from June 1, 2026, provided some relief to input costs.
What the Numbers Show
A key divergence exists between standalone and consolidated profitability. Standalone PAT rose sharply to ₹64.95 crore, whereas consolidated PAT fell to ₹23.82 crore. This discrepancy is largely structural: the Punjab facility incurred full depreciation charges of ₹34.7 crore (up from ₹11.7 crore) and finance costs of ₹38.6 crore (up from ₹4.62 crore), as interest is no longer capitalized. This indicates that while operations are scaling, the financial burden of the new asset base is currently weighing on group-level net margins.
Outlook and Guidance
Management reaffirmed its FY27 EBITDA guidance of ₹520-540 crore. The company plans to phase in a 32-megawatt hybrid wind-solar power arrangement to reduce energy costs. Additionally, Sanathan Textiles is pursuing a greenfield cotton yarn expansion in Madhya Pradesh with an estimated capex of ₹400 crore, targeting 72,500 spindles and incremental revenue of ₹350-375 crore.
Historical Stock Returns for Sanathan Textiles
| 1 Day | 5 Days | 1 Month | 6 Months | 1 Year | 5 Years |
|---|---|---|---|---|---|
| +4.06% | -0.89% | +10.92% | +23.30% | +4.73% | +34.84% |

How will the transition from capitalizing interest to expensing finance costs at the Punjab facility impact consolidated PAT margins in Q2FY27 as capacity utilization reaches 85-90%?
What is the projected timeline for the Madhya Pradesh greenfield project to break even, and how does the ₹400 crore capex align with the company's current debt-to-equity ratio?
Given the reliance on imported PTA and MEG feedstocks, how exposed is the company to future geopolitical supply chain disruptions if the current customs duty waivers on raw cotton are not extended?
 17
17








 Access Market Heat-map & Insights
  Create, Save & Share your Screener
  Use 200+ Screening Filters





