

Sakar Healthcare eyes ₹200 crore oncology revenue in FY27


Sakar Healthcare delivered strong Q1FY27 results with PAT surging 120% to ₹1,028.49 lakhs. During the earnings call, management outlined plans to double oncology revenue to ₹200 crore in FY27, leveraging 16 marketing authorizations and API backward integration to potentially lift EBITDA margins to 35%.


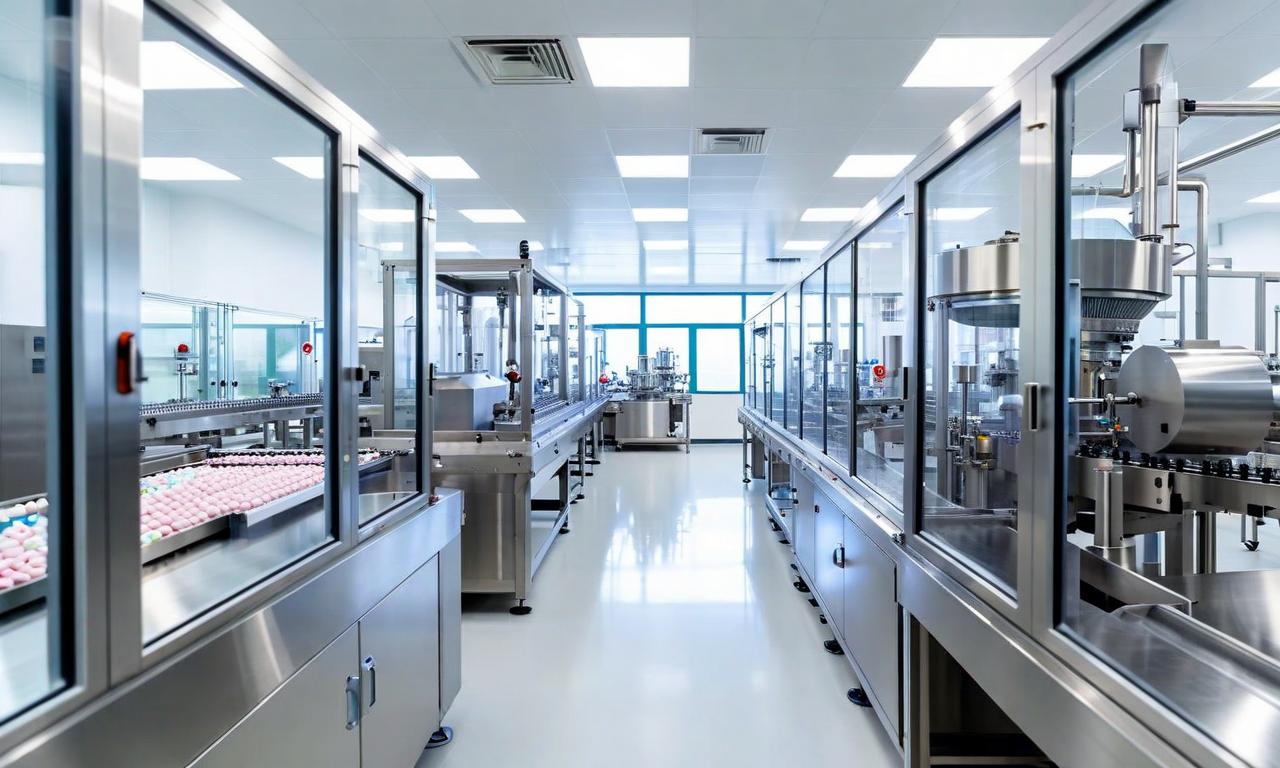
*this image is generated using AI for illustrative purposes only.
Sakar Healthcare reported a 120% year-on-year surge in profit after tax (PAT) to ₹1,028.49 lakhs for Q1FY27, while management outlined aggressive growth targets during the July 29, 2026, earnings call. The company aims to double its oncology division revenue to approximately ₹200 crore in FY27, up from roughly ₹93-94 crore in FY26. This expansion is driven by increasing export volumes, new marketing authorizations (MAs), and deeper integration with global partners like Accord-Intas, Torrent, and Zydus Lifesciences.
The Board of Directors approved the unaudited results on July 24, 2026. Consolidated revenue from operations rose 38% to ₹7,297.25 lakhs, with EBITDA jumping 67% to ₹2,124.89 lakhs. The improved profitability reflects better product mix and operating leverage. Management emphasized that the current facility at Bavla can support revenues of ₹800 crore to ₹1,000 crore at optimal utilization over the next four to five years without significant incremental capital expenditure.
Financial Performance Overview
| Metric | Q1FY27 (₹ Lakhs) | Q1FY26 (₹ Lakhs) | YoY Change | FY26 (₹ Lakhs) |
|---|---|---|---|---|
| Revenue from Operations | 7,297.25 | 5,273.62 | 38% | 25,173.60 |
| Gross Profit | 3,839.03 | 2,378.38 | 61% | 12,845.93 |
| EBITDA | 2,124.89 | 1,270.58 | 67% | 6,888.82 |
| Profit After Tax (PAT) | 1,028.49 | 467.13 | 120% | 3,048.46 |
Oncology Revenue and Export Growth
In Q1FY27, the oncology business generated approximately ₹33 crore, with exports contributing ₹6.5 crore and domestic sales making up the remainder. Management indicated that export contribution is expected to rise significantly, targeting ₹60-70 crore from exports alone in FY27. By FY28, oncology revenue is projected to reach ₹280-300 crore, representing a threefold increase over FY26 levels.
The company has executed more than 65 oncology product contracts and has 178 dossiers submitted globally, resulting in 16 MAs received so far. Seven site variation approvals have been secured for technology transfer projects with key partners. Bikramjit Ghosh, Vice President of Strategy and Business Development, noted that 70-75% of the incremental export revenue will come from MA-based sales, while the rest will stem from site variation products and CMO deals.
Margin Expansion via API Integration
A critical driver for future margin expansion is backward integration through in-house API development. Sakar has developed 21 APIs, with two already receiving CEP approvals (Gefitinib and Cytarabine) and five more in process. Management stated that integrating these APIs into finished dosage forms could push EBITDA margins to 35% or higher for those specific products. Currently, the overall EBITDA margin stands at 29%, up from 24% in Q1FY26, with non-oncology margins hovering around 25%.
What the Numbers Show
The divergence between the company’s total revenue growth (38%) and its oncology segment’s trajectory highlights a strategic pivot toward higher-margin, specialized pharmaceuticals. While the broader pharma market sees modest single-digit growth, Sakar’s oncology division is targeting double-digit annual growth rates. The reliance on exports is shifting from minimal contribution in previous quarters to a projected 30% share of total sales by end-FY27. This shift, combined with API backward integration, suggests a structural improvement in profit quality, moving away from pure contract manufacturing toward proprietary, high-value integrated supply chains.
Historical Stock Returns for Sakar Healthcare
| 1 Day | 5 Days | 1 Month | 6 Months | 1 Year | 5 Years |
|---|---|---|---|---|---|
| -1.65% | -7.54% | +22.76% | +115.67% | +199.99% | +579.52% |

How might regulatory delays in securing the remaining 162 global dossiers impact Sakar Healthcare's ability to meet its aggressive ₹200 crore oncology revenue target for FY27?
What are the potential risks associated with relying on Accord-Intas, Torrent, and Zydus Lifesciences for 70-75% of incremental export revenue, and how diversified is the client base beyond these key partners?
Could the transition from contract manufacturing to proprietary API integration face supply chain bottlenecks that delay the projected EBITDA margin expansion to 35%?
 20
20









 Create Custom Screeners
  Access 200+ Pre-built Filters
  Use 50+ Readymade Screener





