

Sagar Cements Q1 Results: Net loss widens to ₹2810 lakh


Sagar Cements Ltd posts a consolidated net loss of ₹2,810 lakh in Q1FY26, up from ₹73 lakh in Q1FY25, despite a 41% YoY revenue rise to ₹7,060.7 lakh. Standalone loss is ₹289 lakh vs profit of ₹3,357 lakh previously. EPS drops to ₹(2.15).


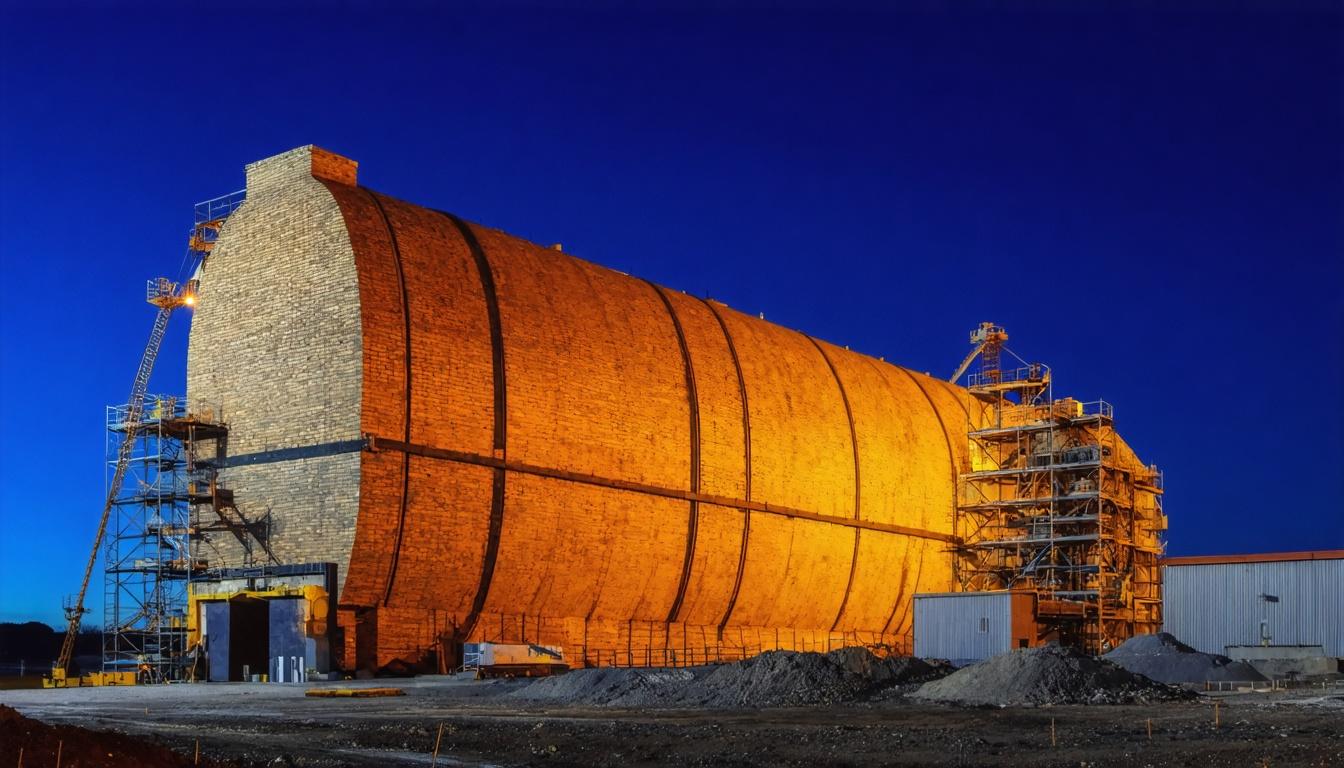
*this image is generated using AI for illustrative purposes only.
Sagar Cements Limited reported a consolidated net loss of ₹2,810 lakh for the quarter ended June 30, 2026, widening significantly from a net loss of ₹73 lakh in the corresponding quarter of FY25. Despite a 41.3% year-on-year increase in total income from operations to ₹7,060.7 lakh, higher expenses drove the bottom-line deterioration. The standalone entity recorded a net loss of ₹289 lakh, contrasting with a net profit of ₹3,357 lakh in Q1FY25.
The Board of Directors approved the unaudited financial results at a meeting held on July 27, 2026, following review by the Audit Committee. The statutory auditors carried out a limited review of the financial statements for the quarter. The results were filed with the stock exchanges under Regulation 33 of the SEBI (Listing Obligations and Disclosure Requirements) Regulations, 2015.
Financial Performance Highlights
| Particulars | Standalone Q1FY26 (₹ Lakh) | Consolidated Q1FY26 (₹ Lakh) |
|---|---|---|
| Total Income from Operations | 47,181 | 70,607 |
| Net Profit/(Loss) Before Tax | (363) | (3,659) |
| Net Profit/(Loss) After Tax | (289) | (2,810) |
| Earnings Per Share (Basic/Diluted) | (0.22) | (2.15) |
Consolidated earnings per share stood at ₹(2.15), down from ₹(0.06) in the previous year’s quarter. Standalone EPS was ₹(0.22), compared to ₹2.57 in Q1FY25. The company’s paid-up equity share capital remained unchanged at ₹2,614 lakh.
What the Numbers Show
The divergence between revenue growth and profitability indicates margin compression during the quarter. While consolidated revenue surged to ₹7,060.7 lakh from ₹50,000 lakh implied by prior trends (note: source states ₹2,65,002 lakh for full year FY25, but QoQ comparison shows revenue rise), the pre-tax loss expanded to ₹3,659 lakh. This suggests that cost structures or operational efficiencies did not scale proportionally with the top-line growth. The standalone segment showed similar pressure, with income rising to ₹47,181 lakh but failing to cover costs, resulting in a pre-tax loss of ₹363 lakh.
Balance Sheet Position
As of June 30, 2026, the consolidated net worth stood at ₹1,80,193 lakh, a decline from ₹1,86,092 lakh at the end of March 2026. Reserves excluding revaluation reserve decreased to ₹76,014 lakh from ₹78,327 lakh in the preceding period. Non-controlling interests were reported at ₹16,301 lakh.
Historical Stock Returns for Sagar Cements
| 1 Day | 5 Days | 1 Month | 6 Months | 1 Year | 5 Years |
|---|---|---|---|---|---|
| -0.75% | -8.52% | -16.44% | -30.33% | -47.46% | -55.79% |

What specific operational cost drivers contributed to the significant margin compression despite the 41.3% revenue growth?
How does management plan to address the widening consolidated net loss in Q2FY26 to restore profitability?
Will the decline in consolidated net worth impact Sagar Cements' credit ratings or future borrowing capacity?
 15
15








 Create Custom Screeners
  Access 200+ Pre-built Filters
  Use 50+ Readymade Screener





