

RSWM Ltd Submits Business Responsibility and Sustainability Report for FY 2025-26


RSWM Limited filed its BRSR for FY 2025-26, reporting a standalone turnover of INR 4,553.98 crores with exports comprising 30.68% of total turnover across 68 countries. The company achieved significant reductions in Scope 1 GHG emissions by 40.48% and Scope 2 emissions by 10.06% year-on-year, supported by renewable energy procurement and biofuel adoption. A total workforce of 18,118 employees and workers was reported, with zero monetary penalties and no data breaches recorded during the year. The company targets Net Zero GHG emissions by FY 2050 and a renewable energy share exceeding 30% of total electricity consumption by FY 2027.


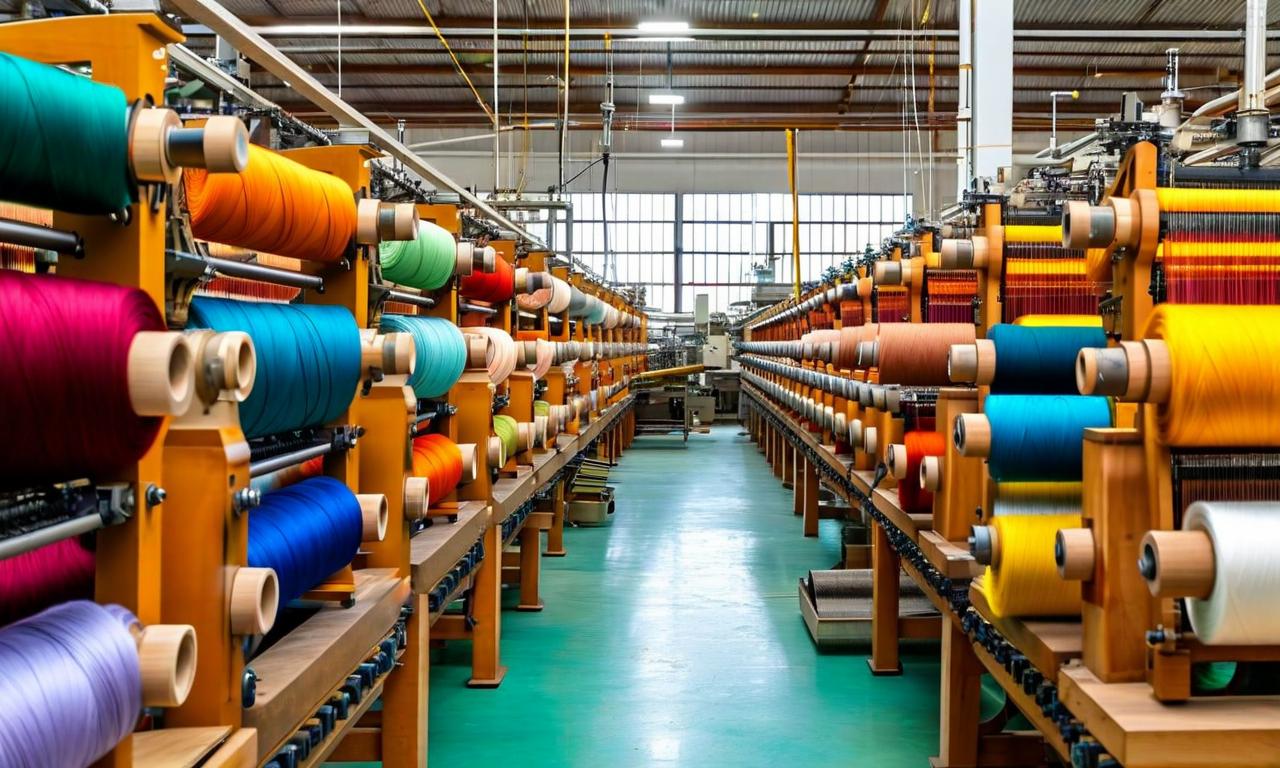
*this image is generated using AI for illustrative purposes only.
RSWM Limited has submitted its Business Responsibility and Sustainability Report (BRSR) for the financial year April 1, 2025 to March 31, 2026, in compliance with Regulation 34(2) of SEBI (Listing Obligations and Disclosure Requirements) Regulations, 2015. The report is filed on a standalone basis and forms part of the company's Integrated Annual Report 2025-26. The report was signed by Surender Gupta, Chief Compliance Officer & Company Secretary, and submitted on August 01, 2026.
Business Overview and Financial Profile
RSWM Limited, formerly Rajasthan Spinning & Weaving Mills Limited, is incorporated with CIN L17115RJ1960PLC008216 and has a paid-up capital of ₹47,10,16,840 (47.10 Crores). The company's total turnover for FY 2025-26 stood at INR 4,553.98 crores, compared to INR 4,825.29 crores in the previous year. Exports accounted for 30.68% of total turnover, with the company serving 68 countries internationally during FY 2025-26. The company's net worth as reported for CSR purposes stood at INR 1,371.65 crores.
The following table summarises the company's primary product/service contribution to turnover:
| Product/Service: | NIC Code | % of Total Turnover |
|---|---|---|
| Spinning, Weaving, Knitting & Processing of Man-made Textile Fibres: | 2470 | 49.09% |
| Cotton Spinning & Weaving: | 2352 | 43.80% |
The company operates 11 national manufacturing plants and 10 offices, with no international facilities. It serves customers across 28 states and 3 Union Territories domestically, and 68 countries internationally.
Workforce and Employee Well-Being
As at the end of FY 2025-26, RSWM Limited employed a total workforce comprising 1,728 employees and 16,390 workers. The gender distribution and composition are detailed below:
| Category: | Total | Male | Male % | Female | Female % |
|---|---|---|---|---|---|
| Permanent Employees: | 1,706 | 1,622 | 95.08% | 84 | 4.92% |
| Other than Permanent Employees: | 22 | 17 | 77.27% | 5 | 22.73% |
| Total Employees: | 1,728 | 1,639 | 94.85% | 89 | 5.15% |
| Permanent Workers: | 15,532 | 13,015 | 83.79% | 2,517 | 16.21% |
| Other than Permanent Workers: | 858 | 655 | 76.34% | 203 | 23.66% |
| Total Workers: | 16,390 | 13,670 | 83.40% | 2,720 | 16.60% |
The Board of Directors comprised 9 members, of whom 1 (9.09%) is female. No female representation was recorded among Key Management Personnel (other than Board) for the reporting period. The company reported a permanent employee turnover rate of 19.97% in FY 2025-26, compared to 25.12% in FY 2024-25, and a permanent worker turnover rate of 53.55% versus 42.82% in the prior year. Wellbeing spending as a percentage of total revenue stood at 0.14% in FY 2025-26, up from 0.11% in FY 2024-25. All permanent employees received 100% coverage under health insurance, accident insurance, and day care facilities, while maternity benefits were extended to all eligible female permanent employees.
Environmental Performance
RSWM Limited reported notable improvements in its environmental metrics during FY 2025-26. Total energy consumed from renewable sources increased to 789.54 TJ from 524.23 TJ in the previous year, while total energy consumed from non-renewable sources declined to 2,571.44 TJ from 3,500.84 TJ. Overall total energy consumption stood at 3,360.98 TJ compared to 4,025.07 TJ in FY 2024-25.
| Energy Parameter: | FY 2025-26 (TJ) | FY 2024-25 (TJ) |
|---|---|---|
| Total Electricity from Renewable Sources: | 456.13 | 300.69 |
| Total Fuel from Renewable Sources: | 333.41 | 153.09 |
| Total Renewable Energy: | 789.54 | 524.23 |
| Total Electricity from Non-Renewable Sources: | 1,514.20 | 1,653.26 |
| Total Fuel from Non-Renewable Sources: | 1,057.24 | 1,847.58 |
| Total Non-Renewable Energy: | 2,571.44 | 3,500.84 |
| Total Energy Consumed: | 3,360.98 | 4,025.07 |
Scope 1 GHG emissions declined to 1,15,640 metric tonnes of CO2 equivalent in FY 2025-26 from 1,94,290 metric tonnes in FY 2024-25, a reduction of 40.48% year-on-year. Scope 2 emissions decreased to 2,99,590 metric tonnes of CO2 equivalent from 3,33,110 metric tonnes, a reduction of 10.06% year-on-year. Biogenic emissions from biomass combustion, reported separately per GHG Protocol guidance and excluded from Scope 1 totals, were 26,936.24 metric tonnes of CO2 equivalent in FY 2025-26. The GHG inventory was independently prepared by an ISO 14064 certified consultant covering all RSWM facilities.
Total water withdrawal for FY 2025-26 was 18,04,679.44 kiloliters, compared to 18,83,332 kiloliters in FY 2024-25, reflecting a 4.18% year-on-year reduction. The company has implemented Zero Liquid Discharge (ZLD) systems at all applicable wet-processing units, ensuring no external wastewater discharge. Total waste generated in FY 2025-26 was 10,453.49 metric tonnes compared to 7,984.76 metric tonnes in FY 2024-25, with the increase primarily attributed to the scale-up of PET bottle recycling operations at the Ringas plant.
Governance, Ethics, and Compliance
RSWM Limited reported zero monetary penalties, fines, settlements, or compounding fees imposed by any regulatory, law enforcement, or judicial authority during FY 2025-26. No instances of disciplinary action against Directors, KMPs, employees, or workers for bribery or corruption were recorded. The company reported zero data breaches during the year. The Lost Time Injury Frequency Rate (LTIFR) for workers improved to 0.19 in FY 2025-26 from 0.50 in FY 2024-25, while the employee LTIFR remained at 0. Total recordable work-related injuries for workers stood at 9, compared to 19 in the prior year.
The company's accounts payable days stood at 40 in FY 2025-26, compared to 41 in FY 2024-25. Sales to dealers/distributors as a percentage of total sales were 14.18% in FY 2025-26 versus 6% in FY 2024-25. Related party purchases as a percentage of total purchases were 1.34%, and related party sales as a percentage of total sales were 0.43%.
Sustainability Initiatives and CSR
RSWM Limited achieved 100% utilization of its green fibre manufacturing capabilities during FY 2025-26 and commissioned renewable energy procurement from the Adani Group, contributing to a renewable share of electricity at 23.15%. The company has outlined a Net Zero GHG emissions target by FY 2050 and aims to increase the renewable energy share to 30%+ of total electricity consumption by FY 2027. Recycled Polyester Fiber usage in spinning accounted for 58.10% of total input material in FY 2025-26, up from 56.46% in FY 2024-25, while 100% of plastic PET bottles used in recycled fibre manufacturing were recycled inputs.
Under CSR, the company undertook projects in Rajasthan covering food provision, poverty and malnutrition eradication, preventive healthcare, sanitation, safe drinking water, and education and vocational skills. CSR spending in aspirational districts included ₹30.51 lakhs for healthcare and sanitation initiatives and ₹1.75 lakhs for education and livelihood projects. A total of 1,82,500 persons benefitted from healthcare-related CSR projects and 62,600 persons from education-related projects, with 100% of beneficiaries from vulnerable and marginalized groups in both categories. Approximately 43.17% of input materials were sourced directly from MSMEs in FY 2025-26, and 56.83% were sourced from within India.
Historical Stock Returns for RSWM
| 1 Day | 5 Days | 1 Month | 6 Months | 1 Year | 5 Years |
|---|---|---|---|---|---|
| -0.01% | -2.53% | -6.18% | +59.33% | +41.55% | -8.58% |

How will RSWM's shift to 30%+ renewable electricity by FY 2027 impact its cost structure and competitiveness against peers relying on non-renewable sources?
Given the significant increase in permanent worker turnover to 53.55%, what strategic initiatives is RSWM planning to implement to stabilize its workforce and reduce recruitment costs?
Will the expansion of PET bottle recycling operations, which drove a 30% increase in waste generation, lead to new revenue streams or require additional capital expenditure for processing infrastructure?







 Access 50+ Readymade Screeners
  Use 200+ Custom Filters
  Get Full Market Insights





