

Patel Engineering publishes Q1FY27 results in newspapers


Patel Engineering Ltd. formally published its unaudited standalone and consolidated financial results for the quarter ended June 30, 2026, in major newspapers on August 11, 2026. This action fulfills regulatory requirements under SEBI Listing Regulations 47 and 52(8). The published results highlight a consolidated net profit of ₹919.87 million and revenue of ₹12,807.39 million, reflecting improved margins and operational stability.


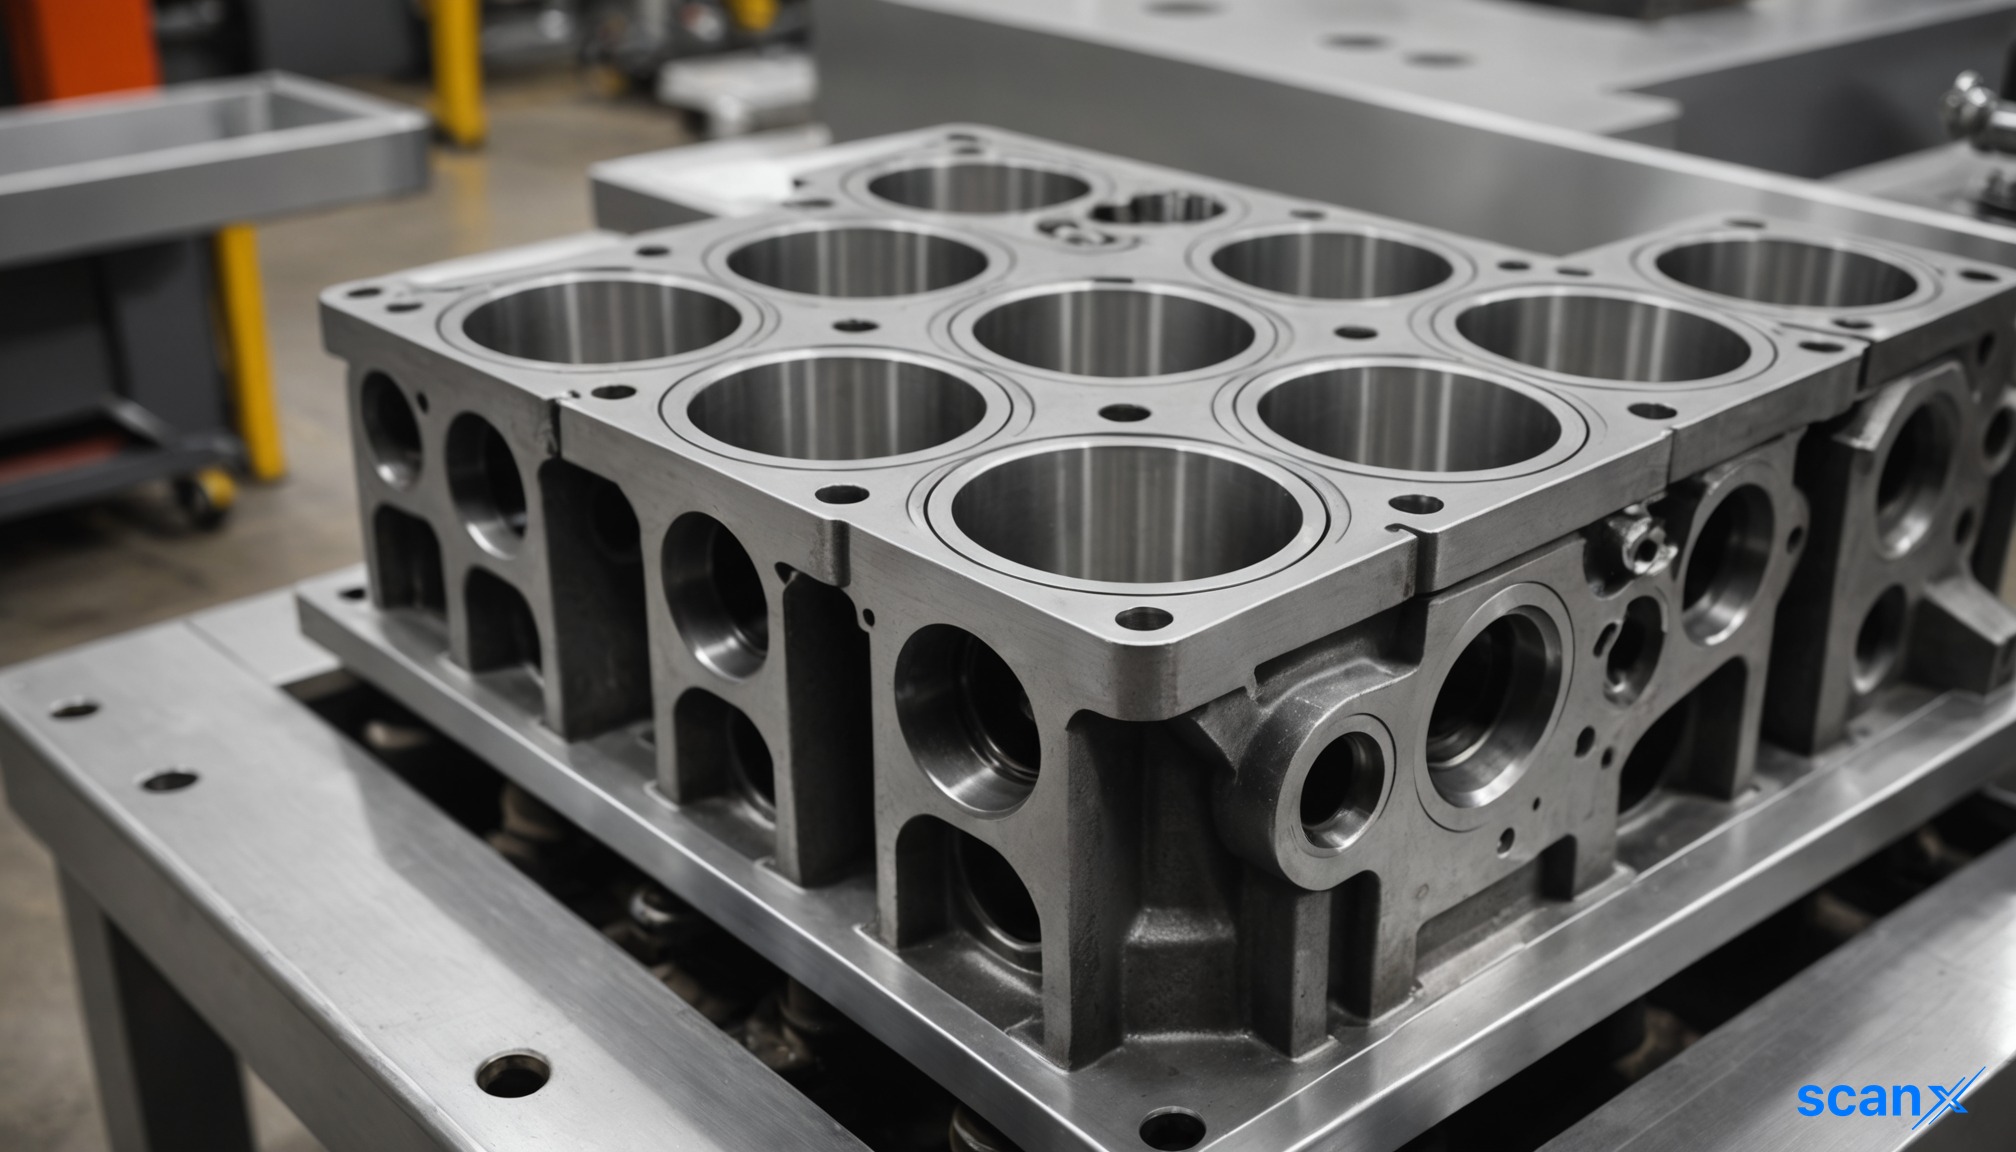
*this image is generated using AI for illustrative purposes only.
Patel Engineering published its unaudited standalone and consolidated financial results for the quarter ended June 30, 2026, in the newspapers Business Standard (English) and Sakal (Marathi) on August 11, 2026. This publication follows the company’s earlier intimation to stock exchanges on August 10, 2026, regarding the approval of its Q1FY27 financials by the Board of Directors. The move ensures wider dissemination of the quarterly performance data to shareholders and stakeholders, complying with disclosure norms under the Securities and Exchange Board of India (Listing Obligations and Disclosure Requirements) Regulations, 2015.
The results, which were subjected to a limited review by M/s. Vatsaraj & Co., the statutory auditors, reflect a consolidated net profit of ₹919.87 million for the quarter, up from ₹800.21 million in the corresponding period of FY25. Revenue from operations stood at ₹12,807.39 million, marking a year-on-year increase of approximately 3.8%. The publication serves as a formal record of the financial outcomes, reinforcing transparency and accessibility for investors who may not have access to digital exchange filings.
Regulatory Compliance and Disclosure
The newspaper advertisements were issued pursuant to Regulation 47 and Regulation 52(8) of the SEBI Listing Regulations, 2015. Shobha Shetty, Company Secretary and Compliance Officer of Patel Engineering Ltd., signed the intimation letter addressed to BSE Limited and The National Stock Exchange of India Limited on August 11, 2026. The documents confirmed that the financial results had been reviewed by the Audit Committee and approved by the Board at its meeting held on August 10, 2026.
| Document Detail | Information |
|---|---|
| Publication Date | August 11, 2026 |
| Newspapers | Business Standard, Sakal |
| Quarter Covered | Ended June 30, 2026 |
| Regulatory Basis | SEBI LODR Regulations 47 & 52(8) |
Financial Highlights Recap
While the primary focus of this update is the procedural publication of results, the underlying financial data remains significant. Consolidated revenue from operations increased to ₹12,807.39 million from ₹12,334.45 million in Q1FY25. Other income contributed ₹254.44 million to total income, which reached ₹13,061.83 million. Total expenses were recorded at ₹11,894.06 million, including finance costs of ₹618.16 million and depreciation of ₹264.52 million. The share in profit from associates rose significantly to ₹65.16 million, compared to ₹9.23 million in the previous year.
Standalone net profit was ₹857.67 million, up from ₹696.05 million in the prior year quarter. Basic earnings per share for the consolidated entity rose to ₹0.98 from ₹0.90, while standalone basic EPS increased to ₹0.86 from ₹0.80. The civil construction segment continued to be the primary driver, generating ₹12,768.20 million in consolidated segment revenue, with the real estate segment contributing ₹39.19 million.
What the Numbers Show
The margin expansion observed in the quarter is notable, with consolidated net profit margin widening to 7.69% from 6.56% in Q1FY25. Operating margin also improved to 14.02% from 13.40%. This improvement occurred despite a slight increase in finance costs, suggesting effective cost management or a favorable project mix within the civil construction division. Additionally, the debt service coverage ratio improved substantially to 1.41 from 0.71 in the previous year, indicating stronger cash flow generation relative to debt obligations. The consolidated debt equity ratio decreased to 0.28 from 0.40, further strengthening the balance sheet position.
Historical Stock Returns for Patel Engineering
| 1 Day | 5 Days | 1 Month | 6 Months | 1 Year | 5 Years |
|---|---|---|---|---|---|
| -1.05% | -4.43% | -7.55% | -7.48% | -30.63% | +0.82% |

Will the significant improvement in the debt service coverage ratio enable Patel Engineering to accelerate its deleveraging strategy or pursue strategic acquisitions in FY27?
How sustainable is the margin expansion to 7.69% given potential inflationary pressures on raw material costs in the civil construction sector?
What specific projects or contract wins are driving the 3.8% revenue growth, and does the order book indicate similar momentum for the remainder of FY27?
 18
18









 Access Market Heat-map & Insights
  Create, Save & Share your Screener
  Use 200+ Screening Filters





