

Manorama Industries FY26 net profit rises to ₹23,321.97 lakh


Manorama Industries Limited reported a net profit of ₹23,321.97 lakh for FY26, a significant rise from ₹11,205.01 lakh in the previous year. Revenue from operations surged to ₹1,35,769.73 lakh, driven by strong domestic and export sales. The board proposed a final dividend of ₹0.80 per share, and EPS improved to ₹39.06.


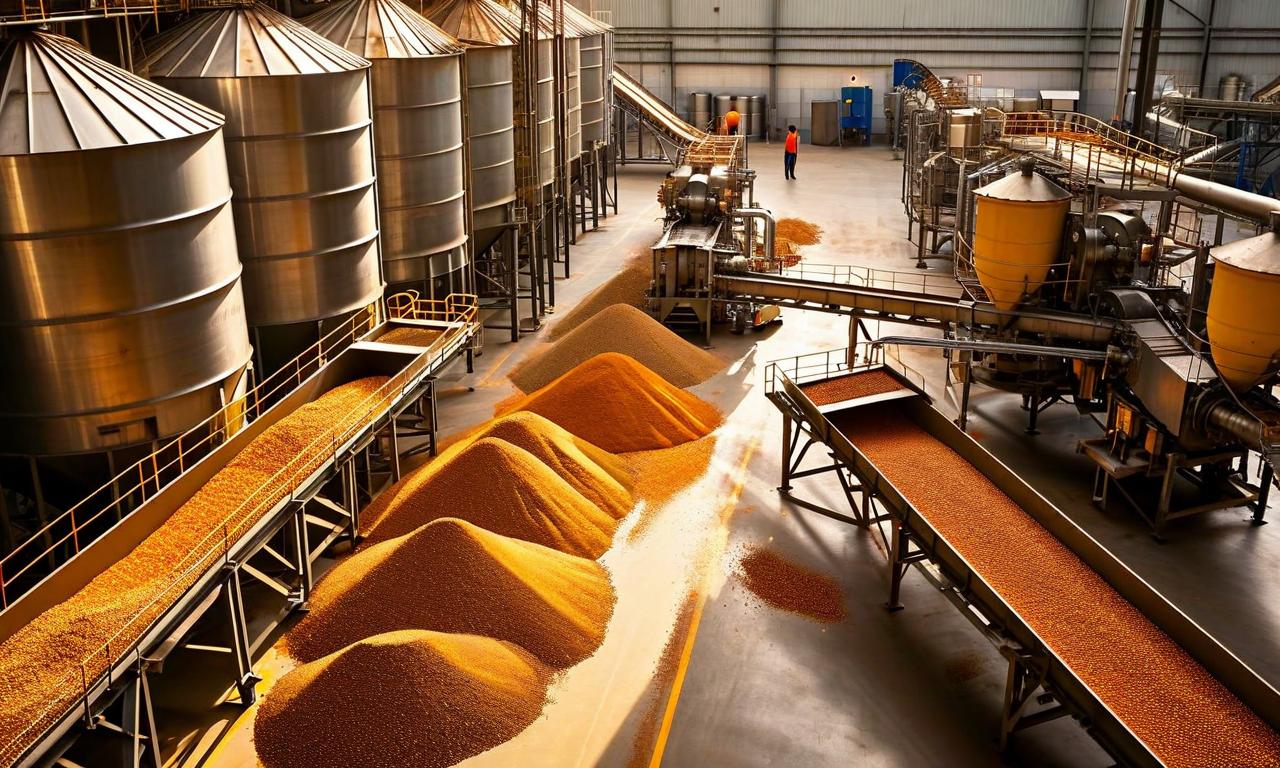
*this image is generated using AI for illustrative purposes only.
Manorama Industries Limited reported a net profit of ₹23,321.97 lakh for the financial year ended March 31, 2026, a significant increase from ₹11,205.01 lakh in the previous year. Revenue from operations surged to ₹1,35,769.73 lakh, driven by strong performance in both domestic and export markets. The company’s total comprehensive income for the period stood at ₹23,144.41 lakh.
Financial Performance
The company’s earnings per share (EPS) for the year improved to ₹39.06, up from ₹18.80 in the prior year. Total expenses for FY26 were recorded at ₹1,05,309.35 lakh. The board of directors has proposed a final dividend of ₹0.80 per share for the year ended March 31, 2026, subject to shareholder approval at the ensuing Annual General Meeting.
Operational Highlights
Revenue from operations was primarily driven by the sale of products and by-products, which amounted to ₹1,35,331.28 lakh. Domestic sales contributed ₹57,788.38 lakh, while exports accounted for ₹77,542.90 lakh. Other operating revenues, including export incentives and duty drawbacks, added ₹438.45 lakh to the total income.
Segment Reporting
The company operates a single identifiable business segment focused on the manufacturing of exotic seed-based fats and butters, including cocoa butter equivalents. As the operations are controlled from India with a significant export component, segment-wise disclosures are not applicable under Ind AS 108.
Balance Sheet and Cash Flows
The company’s total assets as of March 31, 2026, stood at ₹1,19,950.73 lakh. Net cash generated from operating activities was ₹26,936.37 lakh. The company maintained adequate internal financial controls over financial reporting, which were operating effectively as of the reporting date.
Historical Stock Returns for Manorama Industries
| 1 Day | 5 Days | 1 Month | 6 Months | 1 Year | 5 Years |
|---|---|---|---|---|---|
| +1.48% | -2.54% | -0.48% | +66.40% | +34.88% | +816.46% |

What strategies will the company employ to sustain the strong growth in export markets given the current global economic conditions?
How does Manorama Industries plan to utilize the significant increase in operating cash flow to fund future expansion or reduce debt?
Are there plans to diversify beyond the single business segment of exotic seed-based fats and butters to mitigate concentration risks?
 15
15














 Create Custom Screeners
  Access 200+ Pre-built Filters
  Use 50+ Readymade Screener





