
 NewsManorama Industries FY26 PAT Surges 108% to INR 2,332 Mn; Results Published Under Regulation 47
Manorama Industries FY26 PAT Surges 108% to INR 2,332 Mn; Results Published Under Regulation 47


Manorama Industries reported strong FY26 standalone financials with revenue surging 76.1% YoY to INR 13,577 Mn, EBITDA rising 92.5% YoY to INR 3,677 Mn, and PAT jumping 108.1% YoY to INR 2,332 Mn. The Board declared a final dividend of ₹0.80 per equity share and approved financial support of up to ₹350 Crore for its Burkina Faso subsidiary Taang Kaam Industries SA. The audited results were subsequently published in Business Standard (English) and Loksatta (Marathi) on May 13, 2026, pursuant to Regulation 47 of the SEBI LODR Regulations.



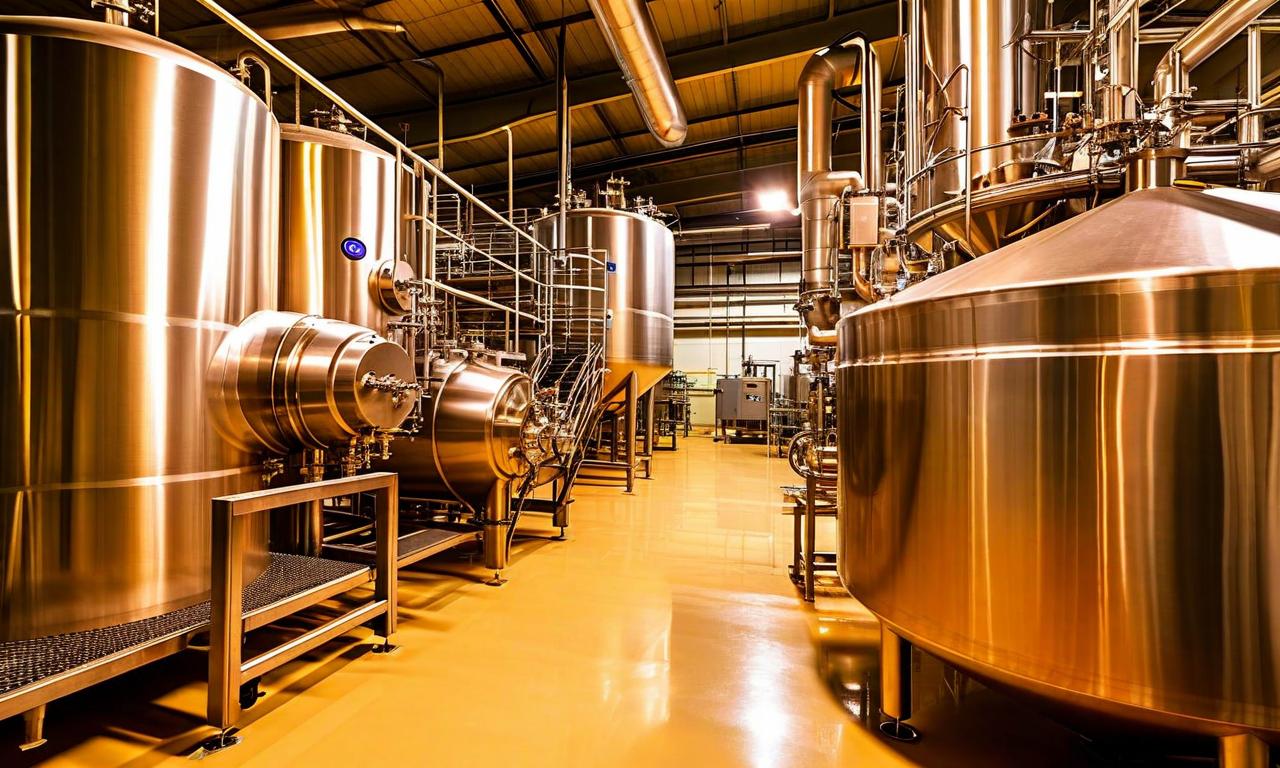
*this image is generated using AI for illustrative purposes only.
Manorama Industries held its Board of Directors meeting on Monday, May 11, 2026, commencing at 4:00 P.M. (IST) and concluding at 6:18 P.M. (IST). The company subsequently filed a revised press release on its audited financial results (both standalone and consolidated) for the quarter and financial year ended March 31, 2026, noting that an incorrect consolidated audited financial results had been inadvertently attached in the earlier filing. The revised submission, signed by Company Secretary and Compliance Officer Deepak Sharma, contains the corrected standalone and consolidated audited financial results. The Audit Report issued by statutory auditors M/s. Singhi & Co., Chartered Accountants (Firm Registration No: 302049E) carries an unmodified (unqualified) opinion. The company, amongst one of the pioneers in the manufacturing of Cocoa Butter Equivalent (CBE), specialty fats & butters and exotic products, delivered FY26 revenue growth of 76.1% YoY to INR 13,577 Mn, EBITDA growth of 92.5% YoY to INR 3,677 Mn, and PAT growth of 108.1% YoY to INR 2,332 Mn on a standalone basis. Pursuant to Regulation 47 of the SEBI (Listing Obligations and Disclosure Requirements) Regulations, 2015, the audited standalone and consolidated financial results for the quarter and financial year ended March 31, 2026 were subsequently published in the following newspapers on May 13, 2026: Business Standard (English) and Loksatta (Marathi).
Standalone Financial Performance
Manorama Industries delivered a strong standalone performance for FY26, with revenue from operations and net profit both registering significant growth compared to the previous year. The following table summarises the key standalone financial metrics:
| Metric: | Q4 FY26 (₹ in lacs) | Q4 FY25 (₹ in lacs) | FY26 (₹ in lacs) | FY25 (₹ in lacs) |
|---|---|---|---|---|
| Revenue from Operations: | 38,229.93 | 23,280.58 | 1,35,769.73 | 77,084.19 |
| Total Income from Operations: | 37,696.81 | 24,186.50 | 1,36,905.25 | 78,940.53 |
| Total Expenses: | 29,615.51 | 18,724.76 | 1,05,309.36 | 64,107.66 |
| Profit Before Tax: | 8,081.29 | 5,461.74 | 31,595.90 | 14,832.87 |
| Net Profit After Tax: | 5,951.64 | 4,226.67 | 23,321.97 | 11,205.01 |
| Total Comprehensive Income: | 5,781.48 | 4,217.53 | 23,144.41 | 11,194.05 |
| Basic EPS (₹): | 9.97 | 7.09 | 39.06 | 18.80 |
| Diluted EPS (₹): | 9.96 | 7.07 | 39.05 | 18.73 |
On a standalone basis, the paid-up equity share capital stood at ₹1,194.17 lacs (face value of ₹2/- each), and reserves excluding revaluation reserves were ₹68,291.95 lacs as at March 31, 2026.
Consolidated Financial Performance
The revised consolidated results encompass Manorama Industries and its nine subsidiaries spanning Nigeria, Dubai, Togo, Brazil, Ghana, Burkina Faso, Ivory Coast, and Benin. The following table presents the corrected consolidated financial metrics:
| Metric: | Q4 FY26 (₹ in lacs) | Q4 FY25 (₹ in lacs) | FY26 (₹ in lacs) | FY25 (₹ in lacs) |
|---|---|---|---|---|
| Revenue from Operations: | 39,134.09 | 23,280.58 | 1,36,673.89 | 77,084.19 |
| Total Income from Operations: | 38,425.45 | 24,232.69 | 1,37,709.20 | 79,184.62 |
| Total Expenses: | 31,067.54 | 18,991.91 | 1,06,893.01 | 64,576.22 |
| Profit Before Tax: | 7,357.91 | 5,240.78 | 30,816.19 | 14,608.40 |
| Net Profit After Tax: | 5,245.89 | 4,004.14 | 22,491.80 | 10,978.95 |
| Total Comprehensive Income: | 5,075.72 | 3,995.00 | 22,314.23 | 10,967.99 |
| Basic EPS (₹): | 8.79 | 6.72 | 37.67 | 18.42 |
| Diluted EPS (₹): | 8.79 | 6.69 | 37.66 | 18.35 |
Consolidated reserves excluding revaluation reserves stood at ₹67,018.72 lacs, and total consolidated assets were ₹1,19,950.73 lacs as at March 31, 2026. Total consolidated equity stood at ₹68,212.89 lacs. For FY26, the Domestic to Export Revenue Mix stood at 43:57, reflecting diversified market presence.
Key Performance Highlights
The following table presents the key standalone performance metrics including EBITDA, margins, and QoQ comparisons:
| Particulars (in INR Millions): | Q4 FY26 | Q4 FY25 | YoY | Q3 FY26 | QoQ | FY26 | FY25 | YoY |
|---|---|---|---|---|---|---|---|---|
| Revenue: | 3,823.0 | 2,328.1 | 64.2% | 3,625.4 | 5.5% | 13,577.0 | 7,708.4 | 76.1% |
| EBITDA: | 1,028.5 | 639.0 | 61.0% | 982.1 | 4.7% | 3,677.1 | 1,910.5 | 92.5% |
| EBITDA Margin: | 26.90% | 27.45% | (54 bps) | 27.1% | (18 bps) | 27.1% | 24.8% | 230 bps |
| PAT: | 595.2 | 422.7 | 40.8% | 682.4 | (12.8%) | 2,332.2 | 1,120.5 | 108.1% |
| PAT Margin: | 15.6% | 18.2% | (259 bps) | 18.8% | (326 bps) | 17.2% | 14.5% | 264 bps |
| Diluted EPS (₹): | 9.96 | 7.07 | 40.9% | 11.43 | (12.9%) | 39.05 | 18.73 | 108.5% |
The growth in revenue was fuelled by a favourable product mix of value-added products, complemented by higher utilization from the enhanced fractionation capacity. EBITDA improvement benefitted from cost control measures and operational optimisation. During the quarter, adverse currency fluctuations resulted in the company recognising a mark-to-market (MTM) provision of ₹17.05 crore on forward contracts entered into in accordance with its foreign exchange hedging policy. The cumulative MTM provision for the financial year stands at ₹23.30 crore. The company also recorded foreign exchange income of ₹9.47 crore during the quarter, resulting in a net foreign exchange loss for the quarter of ₹7.58 crore.
Dividend and Key Board Decisions
The Board approved and recommended a final dividend of ₹0.80 (Eighty Paisa only) per equity share of ₹2/- face value, representing 40% of face value, for FY26. Subject to member approval at the ensuing Annual General Meeting (AGM), the dividend will be paid within 30 days from the date of the AGM. In addition to the financial results and dividend, the Board also resolved the following key matters:
| Decision: | Details |
|---|---|
| Internal Auditor Re-appointment: | CLA Indus Value Consulting Private Limited re-appointed for FY2026-27 |
| Cost Auditor Re-appointment: | M/s. S N & Co., Cost Accountants (FRN: 000309) re-appointed for FY2026-27 |
| Subsidiary Investment – Equity: | Up to ₹150 Crore equity investment / share capital increase in Taang Kaam Industries SA |
| Subsidiary Investment – Unsecured Loan: | Up to ₹100 Crore unsecured loan to Taang Kaam Industries SA |
| Subsidiary Investment – Guarantee/SBLC: | Up to ₹100 Crore via corporate/bank guarantees or Standby Letters of Credit |
The financial support to Taang Kaam Industries SA — a wholly owned subsidiary of Manorama Industries incorporated in Burkina Faso — is intended to support the establishment of a processing factory in Burkina Faso. The support will be extended in one or more tranches, subject to applicable laws and required approvals.
Balance Sheet and Cash Flow Highlights
On a standalone basis, total assets stood at ₹1,20,050.14 lacs as at March 31, 2026, compared to ₹98,502.21 lacs in the prior year. Total equity increased to ₹69,486.12 lacs from ₹46,191.59 lacs. Net cash flow from operating activities was ₹25,936.87 lacs for FY26, compared to a net outflow of ₹5,873.14 lacs in FY25. Cash and cash equivalents at the end of the year stood at ₹743.08 lacs on a standalone basis and ₹994.05 lacs on a consolidated basis. The company's working capital cycle improved to approximately 125 days in FY26. The company achieved a milestone whereby its annual Cash Profit (PAT + Depreciation) of ₹258.77 Crore exceeded its Gross Block (Land + Building + Plant & Machinery) of ₹250.85 Crore, reflecting strong capital efficiency. The company's only reportable business segment is the manufacturing of exotic seed-based fats and butters, including Cocoa Butter Equivalent (CBE), as per IND AS-108.
Management Commentary
Commenting on the performance, Chairman and Managing Director Mr. Ashish Saraf said:
"Manorama Industries has once again delivered a sustainable performance during FY26. The Company achieved revenues of INR 1,358 Crores, reflecting a year-on-year growth of 76.1%. This underscores the sustainable demand for our products across the Food and cosmetics sectors, as well as the strength of our integrated value chain.
By the end of FY26, we boosted the capacity of our Solvent Fractionation Plant 2 (SF 2) by 30%, increasing it from 25,000 to 32,500 tonnes per annum through debottlenecking. We plan to implement similar capacity enhancements for Solvent Fractionation Plant 1 (SF 1), currently at 15,000 TPA.
As we look ahead, we aim to further strengthen our leadership position through planned strategic capex of approx INR 460 crores over the next 2–3 years. This includes investments in forward and backward integration, a new manufacturing facility for cocoa butter alternatives, refinery expansion and the establishment of a processing plant in Burkina Faso.
Manorama's net cash flow from operating activities stood at INR 259 Crores as on 31st March 2026. Our working capital cycle improved to approximately 125 days in FY26. Additionally, the Company's Board announced a final dividend of INR .80 paise (40% of face value of INR 2 per equity share) for financial year 2025-26."
Company Background
Manorama Industries is a Chhattisgarh-based manufacturer established in 2005, with its registered office in Mumbai, Maharashtra. The company has carved a niche in manufacturing Sal CBE & Stearin, Shea CBE & Stearin, Mango CBE & Stearin and other exotic fats & butters, offering customised solutions to companies in the chocolate, confectionery and cosmetic industries. The company holds multiple internationally recognised certifications, including ISO 9001, ISO 14001 & ISO 45001, and is certified for RSPO, Kosher, Halal (MUI), EcoVadis Committed Badge, and Sedex SMETA 4-Pillar. It is also a Government of India Recognized Star Export House and MSME ZED GOLD certified. The trading window, which was closed pursuant to the earlier intimation dated March 25, 2026, is set to reopen from Wednesday, May 13, 2026, following the 48-hour period post the declaration of financial results.
Historical Stock Returns for Manorama Industries
| 1 Day | 5 Days | 1 Month | 6 Months | 1 Year | 5 Years |
|---|---|---|---|---|---|
| +1.48% | -2.54% | -0.48% | +66.40% | +34.88% | +816.46% |

How will the planned ₹460 crore strategic capex over the next 2–3 years impact Manorama Industries' debt levels and return on equity, given that current cash and equivalents stand at under ₹10 crore?
What are the geopolitical and operational risks associated with establishing a processing factory in Burkina Faso through Taang Kaam Industries SA, given the region's ongoing political instability?
With 57% of FY26 revenue coming from exports and a cumulative MTM forex loss of ₹23.30 crore, how might further currency volatility affect profitability in FY27 as the company scales its international operations?
 17
17









 Access Market Heat-map & Insights
  Create, Save & Share your Screener
  Use 200+ Screening Filters





