

Lakshmi Mills net profit turns positive at ₹311 lakh in Q1FY27


Lakshmi Mills posted a Q1FY27 net profit of ₹311.1 lakh, reversing a ₹2,203.0 lakh loss from the prior year. Revenue grew 8.4% to ₹5,971.9 lakh, with both Textiles and Rental Services segments contributing to the turnaround. The profit recovery was aided by controlled expenses and a substantial drop in tax expenses compared to the previous year's high deferred tax provisions.


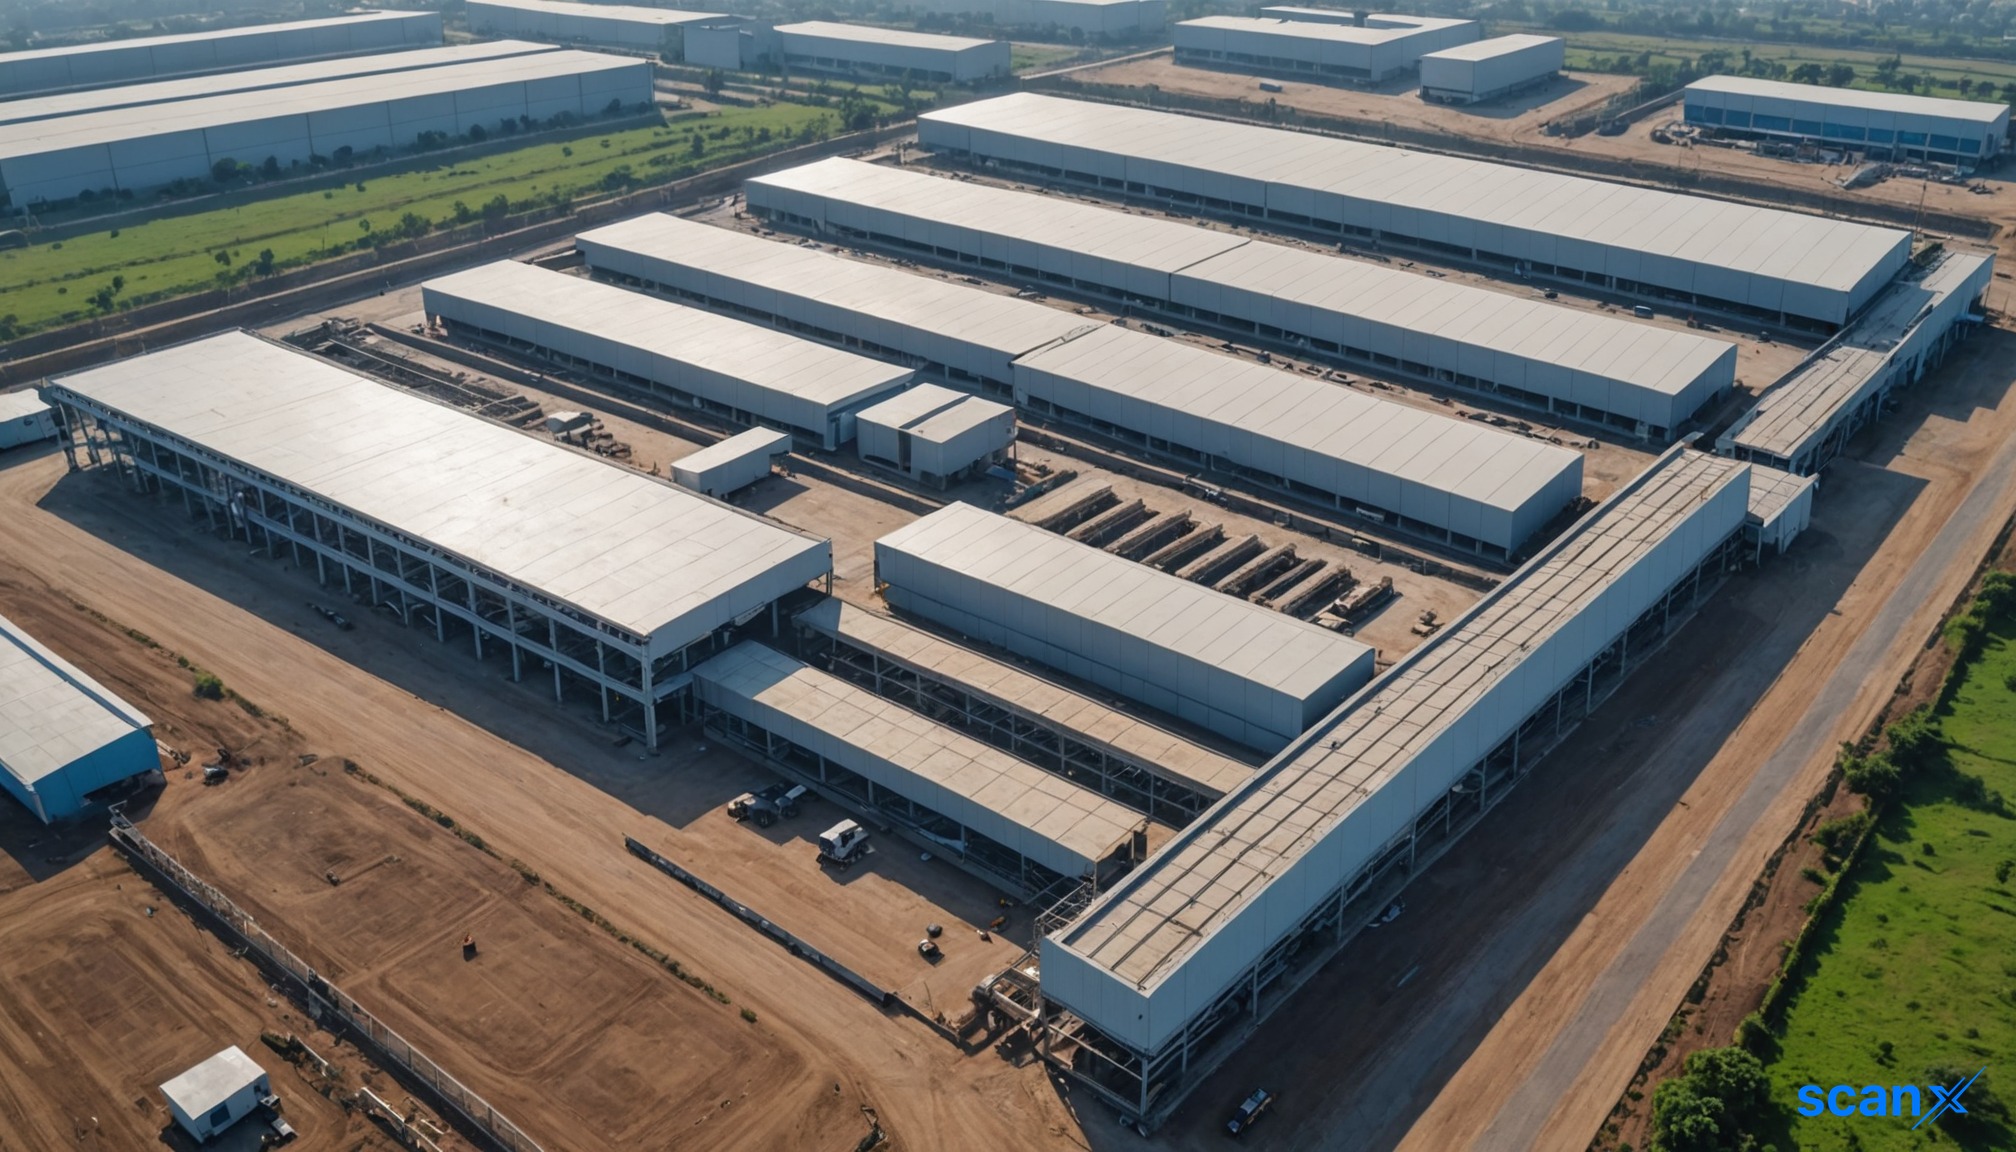
*this image is generated using AI for illustrative purposes only.
The Lakshmi Mills Company Limited reported a net profit of ₹311.1 lakh for the quarter ended June 30, 2026, marking a sharp turnaround from the net loss of ₹2,203.0 lakh posted during the same period last year. The company’s revenue from operations rose 8.4% year-on-year to ₹5,971.9 lakh, up from ₹5,507.0 lakh in Q1FY26. This improvement reflects a broader operational recovery, with earnings per share (EPS) turning positive at ₹44.72 compared to a loss of ₹316.72 per share in the prior year.
Financial Performance
Total income for the quarter stood at ₹6,015.0 lakh, while total expenses were contained at ₹5,603.4 lakh. Profit before tax amounted to ₹411.6 lakh, significantly higher than the pre-tax loss of ₹100.3 lakh recorded in Q1FY26. Tax expenses for the current quarter were ₹100.5 lakh, comprising current tax of ₹71.7 lakh and deferred tax of ₹28.8 lakh. In contrast, the previous year’s period saw a massive tax expense of ₹2,102.7 lakh, largely driven by deferred tax provisions.
| Metric | Q1FY27 | Q1FY26 | Change |
|---|---|---|---|
| Revenue from Operations | ₹5,971.9 lakh | ₹5,507.0 lakh | +8.4% |
| Net Profit/(Loss) | ₹311.1 lakh | (₹2,203.0) lakh | Turnaround |
| EPS (Basic) | ₹44.72 | (₹316.72) | Positive |
| Total Expenses | ₹5,603.4 lakh | ₹5,645.0 lakh | -0.7% |
Segment Analysis
The company operates through two primary segments: Textiles and Rental Services. The Textiles segment, which involves manufacturing and sale of yarn and trading in fabrics, generated revenue of ₹5,313.3 lakh, up from ₹4,909.0 lakh in the previous year. More critically, the segment swung to a profit before interest and tax (PBIT) of ₹141.7 lakh, recovering from a PBIT loss of ₹191.8 lakh in Q1FY26.
Rental Services contributed ₹686.3 lakh in revenue, an increase from ₹619.9 lakh year-ago. The segment delivered a robust PBIT of ₹553.6 lakh, up from ₹466.0 lakh in the prior period, highlighting its role as a stable cash flow generator for the group.
What the Numbers Show
A key divergence exists between the operational profitability and the tax burden in the comparative periods. While the pre-tax position improved by over ₹500 lakh year-on-year, the total tax expense dropped sharply from ₹2,102.7 lakh in Q1FY26 to just ₹100.5 lakh in Q1FY27. This suggests that the prior year’s significant loss was heavily influenced by deferred tax accounting adjustments rather than purely operational deficits, as the current quarter’s lower tax outflow aligns more closely with the modest pre-tax profits generated.
Balance Sheet and Other Metrics
Finance costs decreased to ₹213.9 lakh from ₹322.5 lakh in the previous year, indicating reduced interest burdens or lower debt levels. Depreciation and amortization expenses also fell to ₹272.2 lakh from ₹332.4 lakh. Total comprehensive income for the quarter was ₹16,158.2 lakh, driven primarily by other comprehensive income items that will not be reclassified to profit or loss, which stood at ₹18,489.8 lakh after tax effects.
The unaudited financial results were reviewed by the Audit Committee and approved by the Board of Directors on August 14, 2026. Statutory auditors Subbachar & Srinivasan Chartered Accountants issued an unmodified review report on the standalone financial results.
Historical Stock Returns for Lakshmi Mills
| 1 Day | 5 Days | 1 Month | 6 Months | 1 Year | 5 Years |
|---|---|---|---|---|---|
| -0.53% | +4.92% | +3.78% | +1.16% | +1.16% | +1.16% |

Will the reduction in finance costs indicate a broader debt deleveraging strategy, and how might this impact Lakshmi Mills' future borrowing capacity?
Given the Textiles segment's return to profitability, what specific operational changes or market conditions drove the swing from a PBIT loss to a profit?
How sustainable is the Rental Services segment's role as a cash flow generator amidst potential shifts in commercial real estate demand?
 20
20






 Create Custom Screeners
  Access 200+ Pre-built Filters
  Use 50+ Readymade Screener





