

Kajaria Ceramics files FY26 sustainability report with DNV assurance


- Kajaria Ceramics filed its FY26 BRSR report disclosing a consolidated turnover of ₹4,832.50 crore
- Total energy consumption fell to 85,34,536 GJ, down from 89,64,217 GJ in FY25
- Scope 1 and Scope 2 greenhouse gas emissions declined to 4,14,938 and 1,72,370 tCO2e respectively
- Zero Liquid Discharge facilities remain operational across all manufacturing plants
- DNV provided reasonable assurance on the core ESG indicators for the reporting period


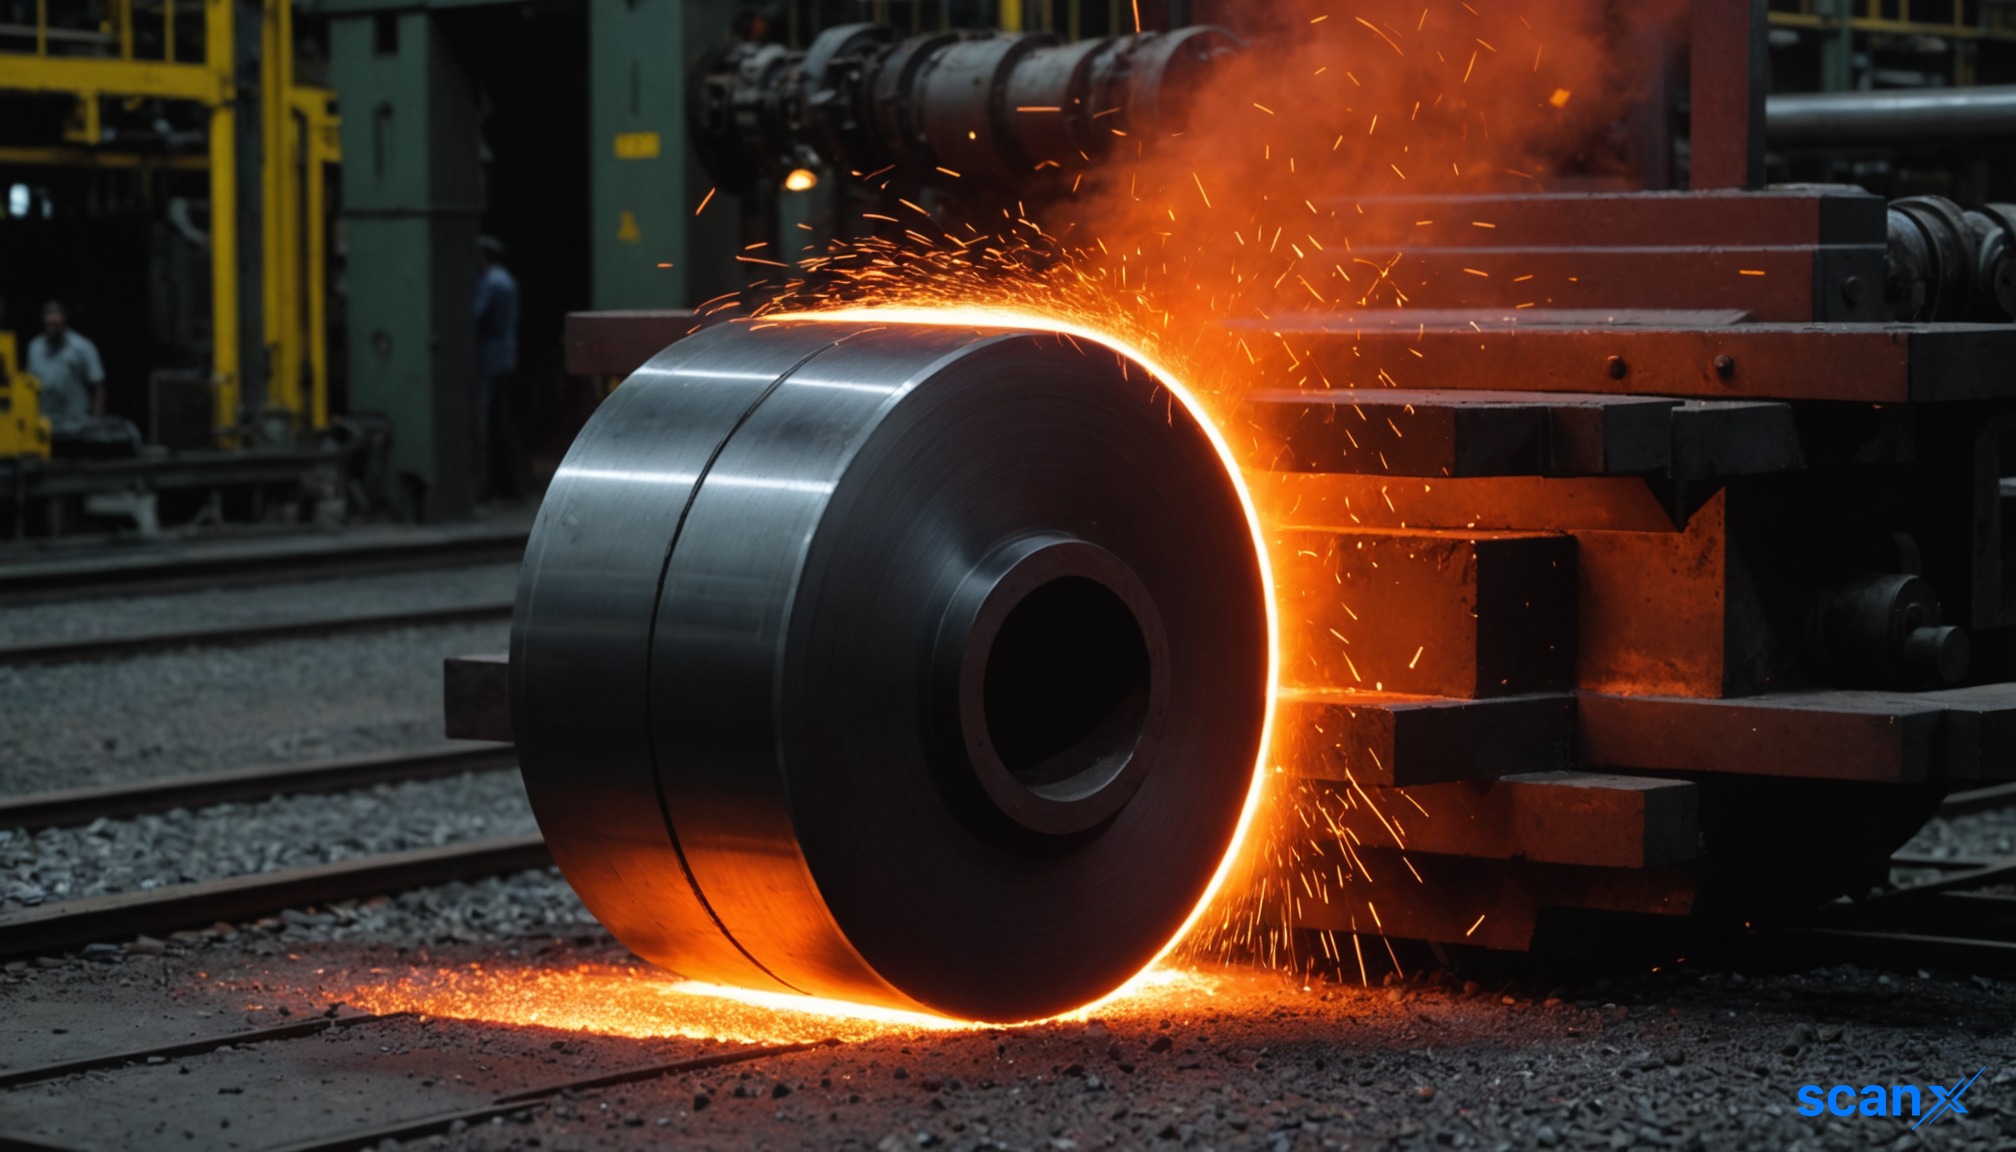
*this image is generated using AI for illustrative purposes only.
Kajaria Ceramics Limited filed its Business Responsibility & Sustainability Report (BRSR) for the financial year ended March 31, 2026, on August 21, 2026. The disclosure covers the company’s consolidated operations across India and highlights its environmental, social, and governance performance for FY26.
The report was signed by Vinit Kumar, General Counsel & Company Secretary. It details the entity’s operational footprint, which includes 12 national plants and one international facility, serving markets in 36 states and union territories domestically, alongside exports to 28 countries.
Financial Scope and Structure
The BRSR report discloses a consolidated turnover of ₹4,832.50 crore and a net worth of ₹3,065.58 crore for the period. The reporting boundary encompasses Kajaria Ceramics Limited and its subsidiaries, including Kajaria Vitrified Private Limited, Kajaria Infinity Private Limited, and Kajaria Sanitaryware Private Limited.
Revenue concentration remains heavily skewed toward its core business. The manufacturing and trading of ceramic and vitrified tiles accounted for 88.57% of total turnover. Other segments, including sanitaryware, faucets, tile adhesives, and plywood products, contributed the remaining 11.43%.
Environmental Performance
The company reported a reduction in total energy consumption to 85,34,536 GJ in FY26, down from 89,64,217 GJ in the previous year. This decline coincided with a decrease in energy intensity per rupee of turnover from 0.00019 GJ/INR to 0.00018 GJ/INR.
Greenhouse gas emissions also saw a downward trajectory. Total Scope 1 emissions fell to 4,14,938 metric tonnes of CO2 equivalent, compared to 4,37,311 metric tonnes in FY25. Similarly, Scope 2 emissions decreased to 1,72,370 metric tonnes from 1,87,602 metric tonnes.
Water stewardship remains a key focus, with the company maintaining Zero Liquid Discharge (ZLD) facilities across all manufacturing plants. Total water withdrawal stood at 14,64,716 kilolitres, a slight decrease from 15,23,477 kilolitres in FY25.
Social Metrics and Governance
The workforce composition for FY26 included 2,285 permanent employees and 4,995 workers. Female representation among permanent employees was recorded at 4%, while it stood at 3% for workers. The board of directors comprises nine members, with one female director representing 11.11% of the total.
Safety metrics showed mixed results. The Lost Time Injury Frequency Rate (LTIFR) for employees improved to 0.37 from 0.45 in the prior year. However, the LTIFR for workers increased slightly to 0.39 from 0.32. There was one fatality reported among workers during the year, compared to none in FY25.
What the Numbers Show
The data reveals a divergence between operational efficiency gains and safety outcomes for the manual workforce. While energy intensity and greenhouse gas emissions declined alongside reduced total energy consumption, indicating improved resource efficiency, the rise in worker LTIFR suggests that safety protocols may require reinforcement despite overall environmental progress.
| Metric | FY26 | FY25 | Change |
|---|---|---|---|
| Total Energy Consumption (GJ) | 85,34,536 | 89,64,217 | Decrease |
| Scope 1 Emissions (tCO2e) | 4,14,938 | 4,37,311 | Decrease |
| Scope 2 Emissions (tCO2e) | 1,72,370 | 1,87,602 | Decrease |
| Water Withdrawal (KL) | 14,64,716 | 15,23,477 | Decrease |
Assurance and Compliance
DNV Business Assurance India Private Limited provided reasonable assurance on the BRSR Core Indicators. The assurance covered the company’s operations in India, with specific boundaries applied to different ESG attributes. The report confirms compliance with applicable environmental laws and regulations, with no fines or penalties disclosed during the financial year.
Historical Stock Returns for Kajaria Ceramics
| 1 Day | 5 Days | 1 Month | 6 Months | 1 Year | 5 Years |
|---|---|---|---|---|---|
| -0.05% | +2.04% | -2.08% | +24.61% | +0.63% | +0.77% |

How might the divergence between improved environmental efficiency and rising worker safety incidents impact Kajaria Ceramics' ESG ratings and investor sentiment in the coming quarters?
Given the heavy reliance on core tile manufacturing for 88.57% of turnover, what strategic initiatives is the company pursuing to diversify revenue streams and mitigate sector-specific risks?
Will the company's current Zero Liquid Discharge infrastructure be sufficient to meet anticipated stricter water regulations in India, or are further capital expenditures planned for water stewardship?
 19
19





 Access 50+ Readymade Screeners
  Use 200+ Custom Filters
  Get Full Market Insights





