JSW Dulux Limited held its investor call on 14th May 2026, presenting audited financial results for the quarter and full year ended 31st March 2026. The Board of Directors, in its meeting held on 13th May 2026, approved the standalone and consolidated financial results and recommended a final dividend of ₹50 per share. In compliance with Regulation 30 of the SEBI (Listing Obligations and Disclosure Requirements) Regulations, 2015, the company also published newspaper advertisements on 15th May 2026 in Business Standard (all India editions) in English and Aaj Kaal in Bengali, notifying stakeholders of the financial results for the quarter and year ended 31st March 2026. The company reported a significant increase in full-year net profit, primarily driven by exceptional items including the sale of the Powder Coatings and International Research Center (IRC) divisions.
Financial Performance
For the full year FY26, the company reported a consolidated net profit of ₹1,973.8 Cr, a sharp increase of 360% compared to ₹429.5 Cr in the previous year. This surge was largely attributed to exceptional items totaling ₹1,845.9 Cr, primarily from the profit on the slump sale of the Powder Coatings and IRC business. Excluding these exceptional items, the PAT for the year stood at ₹382.3 Cr, a 5% increase on a comparable basis.
Revenue from operations for the full year stood at ₹3,599.2 Cr, a decline of 12% from ₹4,069.3 Cr in the prior year, reflecting the impact of the carved-out business. On a comparable basis excluding the carved-out business, full-year revenue was broadly flat at -1%. EBITDA for the year decreased by 21% to ₹508.5 Cr from ₹641.5 Cr on a reported basis, while EBITDA excluding the carved-out business declined 7% to ₹508.5 Cr from ₹546.1 Cr.
In the fourth quarter (Q4 FY26), revenue from operations was ₹883.3 Cr, a decrease of 13% from ₹1,014.4 Cr in the corresponding quarter of the previous year on a reported basis. However, on a comparable basis excluding the carved-out business, Q4 revenue grew by 6.2%. Q4 PAT increased by 16% to ₹125.7 Cr from ₹108.4 Cr in the prior year. The investor presentation highlighted that Q4 PAT on a comparable basis grew 52% to ₹125.7 Cr from ₹82.9 Cr, aided in part by income from the sale of a Real Estate asset (₹64.8 Cr).
The following table presents the reported consolidated P&L for Q4 and full year FY26:
| Metric: |
Q4 FY26 (₹ Cr) |
Q4 FY25 (₹ Cr) |
Change |
FY26 (₹ Cr) |
FY25 (₹ Cr) |
Change |
| Revenue from Operations |
883.3 |
1,014.4 |
-13% |
3,599.2 |
4,069.3 |
-12% |
| Gross Margin |
358.5 |
433.7 |
-17% |
1,490.4 |
1,751.3 |
-15% |
| OPEX |
231.6 |
274.3 |
-16% |
981.9 |
1,109.8 |
-12% |
| EBITDA |
126.9 |
159.3 |
-20% |
508.5 |
641.5 |
-21% |
| PBT |
169.7 |
137.6 |
23% |
2,365.5 |
570.0 |
315% |
| PAT |
125.7 |
108.4 |
16% |
1,973.8 |
429.5 |
360% |
| PAT excl. Exceptionals |
125.7 |
108.4 |
16% |
382.3 |
429.5 |
-11% |
| EBITDA% |
14.4% |
15.7% |
— |
14.1% |
15.8% |
— |
| PAT% |
14.2% |
10.7% |
— |
54.8% |
10.6% |
— |
| PAT% excl. Exceptionals |
14.2% |
10.7% |
— |
10.6% |
10.6% |
— |
Volume and Revenue Growth Trend
The investor presentation highlighted that H1 FY26 was impacted by the strategic review, while H2 saw a renewed focus resulting in a strong finish to the year. Volume growth improved progressively across quarters, with Q4 recording a strong 23% growth. On a comparable basis (excluding carved-out business), revenue growth also turned positive in Q4 at 6.2%.
| Quarter: |
Volume Growth |
Revenue Growth (Comparable Basis) |
| Q1 |
-3% |
-3.9% |
| Q2 |
3% |
-1.3% |
| Q3 |
6% |
-2.1% |
| Q4 |
23% |
6.2% |
Business Segment Highlights
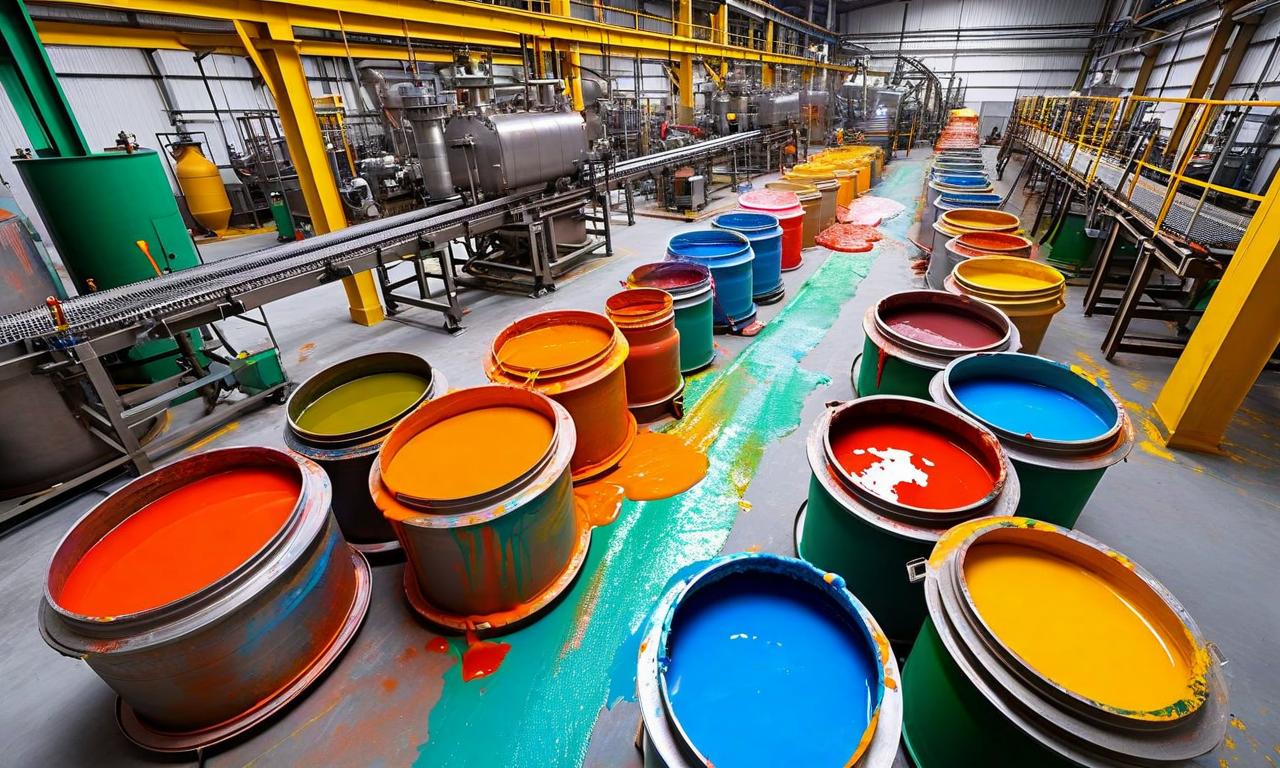
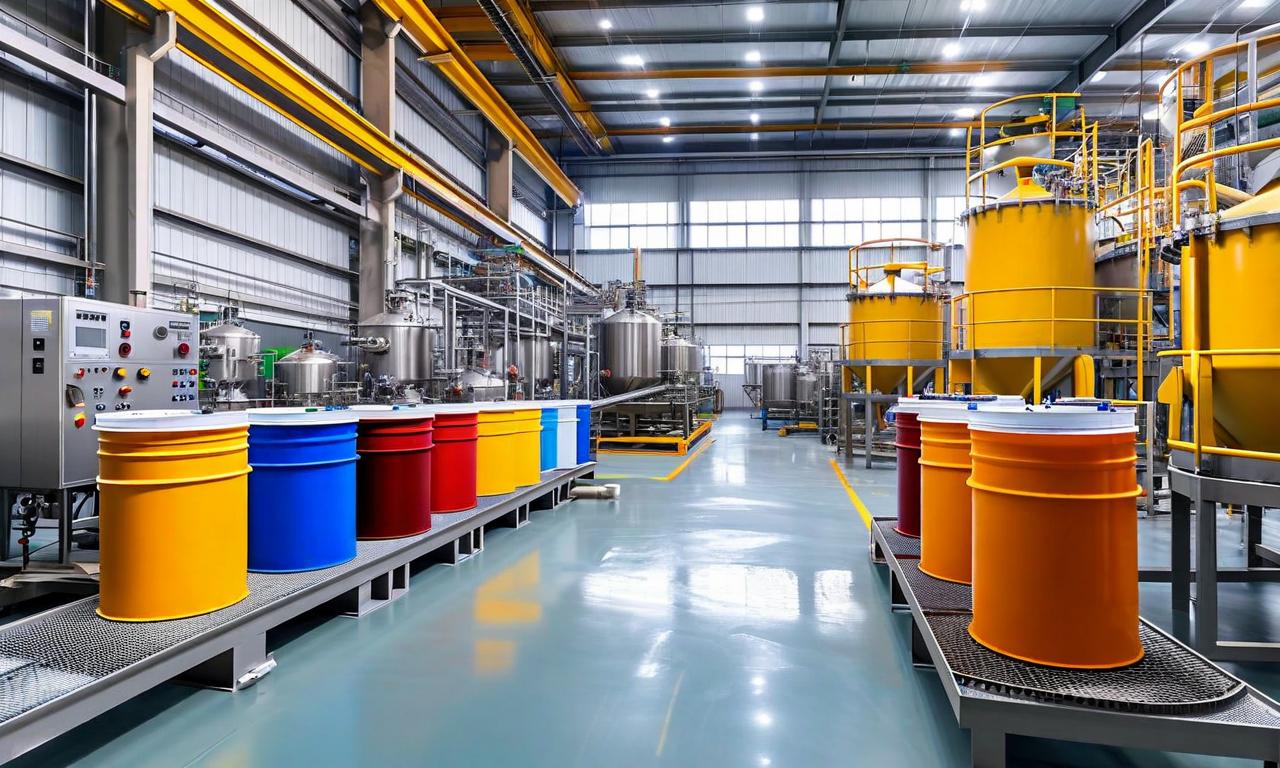
Decorative Paints witnessed a rebound in volume growth amid competitive pressure. Pricing corrections were taken in January–February to reduce the pricing premium in select categories, followed by price increases of approximately 10% taken in March–May. New launches included VT Luxury Finishes and Mass & Economy Primers. Premium traction continued, with retail and semi-urban geographies growing faster.
Industrial Paints demonstrated customer-focused solutions across verticals. In Auto & Specialty Coatings, the company expanded its market presence in the premium segment and maintained and expanded its exclusive partnership through strategic new wins with a leading OEM manufacturer in India. Sikkens was highlighted as the recommended paint partner for Porsche India's repair network. In Marine & Protective Coatings, the company achieved its highest revenue in March, with strong growth in orders in Oil & Gas (specialty projects and exports), Infrastructure, Blade, and Dry Dock business. Industrial Coatings saw growth in Coil, including marquee project wins.
Dividend Declaration
The Board has recommended a final dividend of ₹50 per equity share for FY26, subject to shareholder approval at the ensuing Annual General Meeting. The record date for determining eligibility has been fixed as Friday, 3rd July 2026. Including the special interim dividend of ₹156 per share paid during the year, the total recommended dividend for FY26 stands at ₹206 per share. The 72nd Annual General Meeting is scheduled to be held on Friday, 10th July 2026, via Video Conference.
Corporate and Strategic Developments
Several key corporate updates were disclosed during the investor call. The company's name was formally amended to "JSW Dulux Limited" (formerly Akzo Nobel India Limited) in its Articles of Association and on stock exchanges. The corporate office has been relocated to JSW Center, Mumbai, effective 1st April 2026. Board strengthening included the appointment of Mr. Kaustubh Sudhakar Kulkarni as Non-Executive Director and Ms. Sutapa Banerjee as Independent Director. Ms. Ritika Chopra was appointed as Senior Management Personnel (Head HR) effective 13th May 2026.
The Board has recommended the appointment of M/s. Deloitte Haskins & Sells LLP as Statutory Auditors for a term of five years, subject to shareholder approval, succeeding M/s. Price Waterhouse Chartered Accountants LLP whose term concludes at the upcoming AGM. M/s. Chandra Wadhwa & Co. has been appointed as Cost Auditor for FY 2026-27.
JSW Dulux's stated strategic ambition is to be the preferred brand of choice for consumers, customers, and employees, driven by innovation, superior quality, and customer service while gaining market share and growing EBITDA. Key strategic pillars include geographic expansion to 6,000 towns, product range expansion with innovative offerings, reinvesting royalty savings towards increased painter engagement and brand initiatives, and unlocking synergies and scale of operations through value engineering.


 16
16