

Indo Tech Transformers bags Rs 42.88 crore order from Leap Green Energy


- Indo Tech Transformers won a Rs 42.88 crore order from Leap Green Energy Group.
- The order covers transformers for Solar and Wind projects for Magnolia Powertec and Crocus Green Energy.
- Total Q2FY27 order inflow now stands at Rs 317.43 crore across four disclosed deals.
- Company maintains zero TTM revenue despite strong historical standalone growth rates.



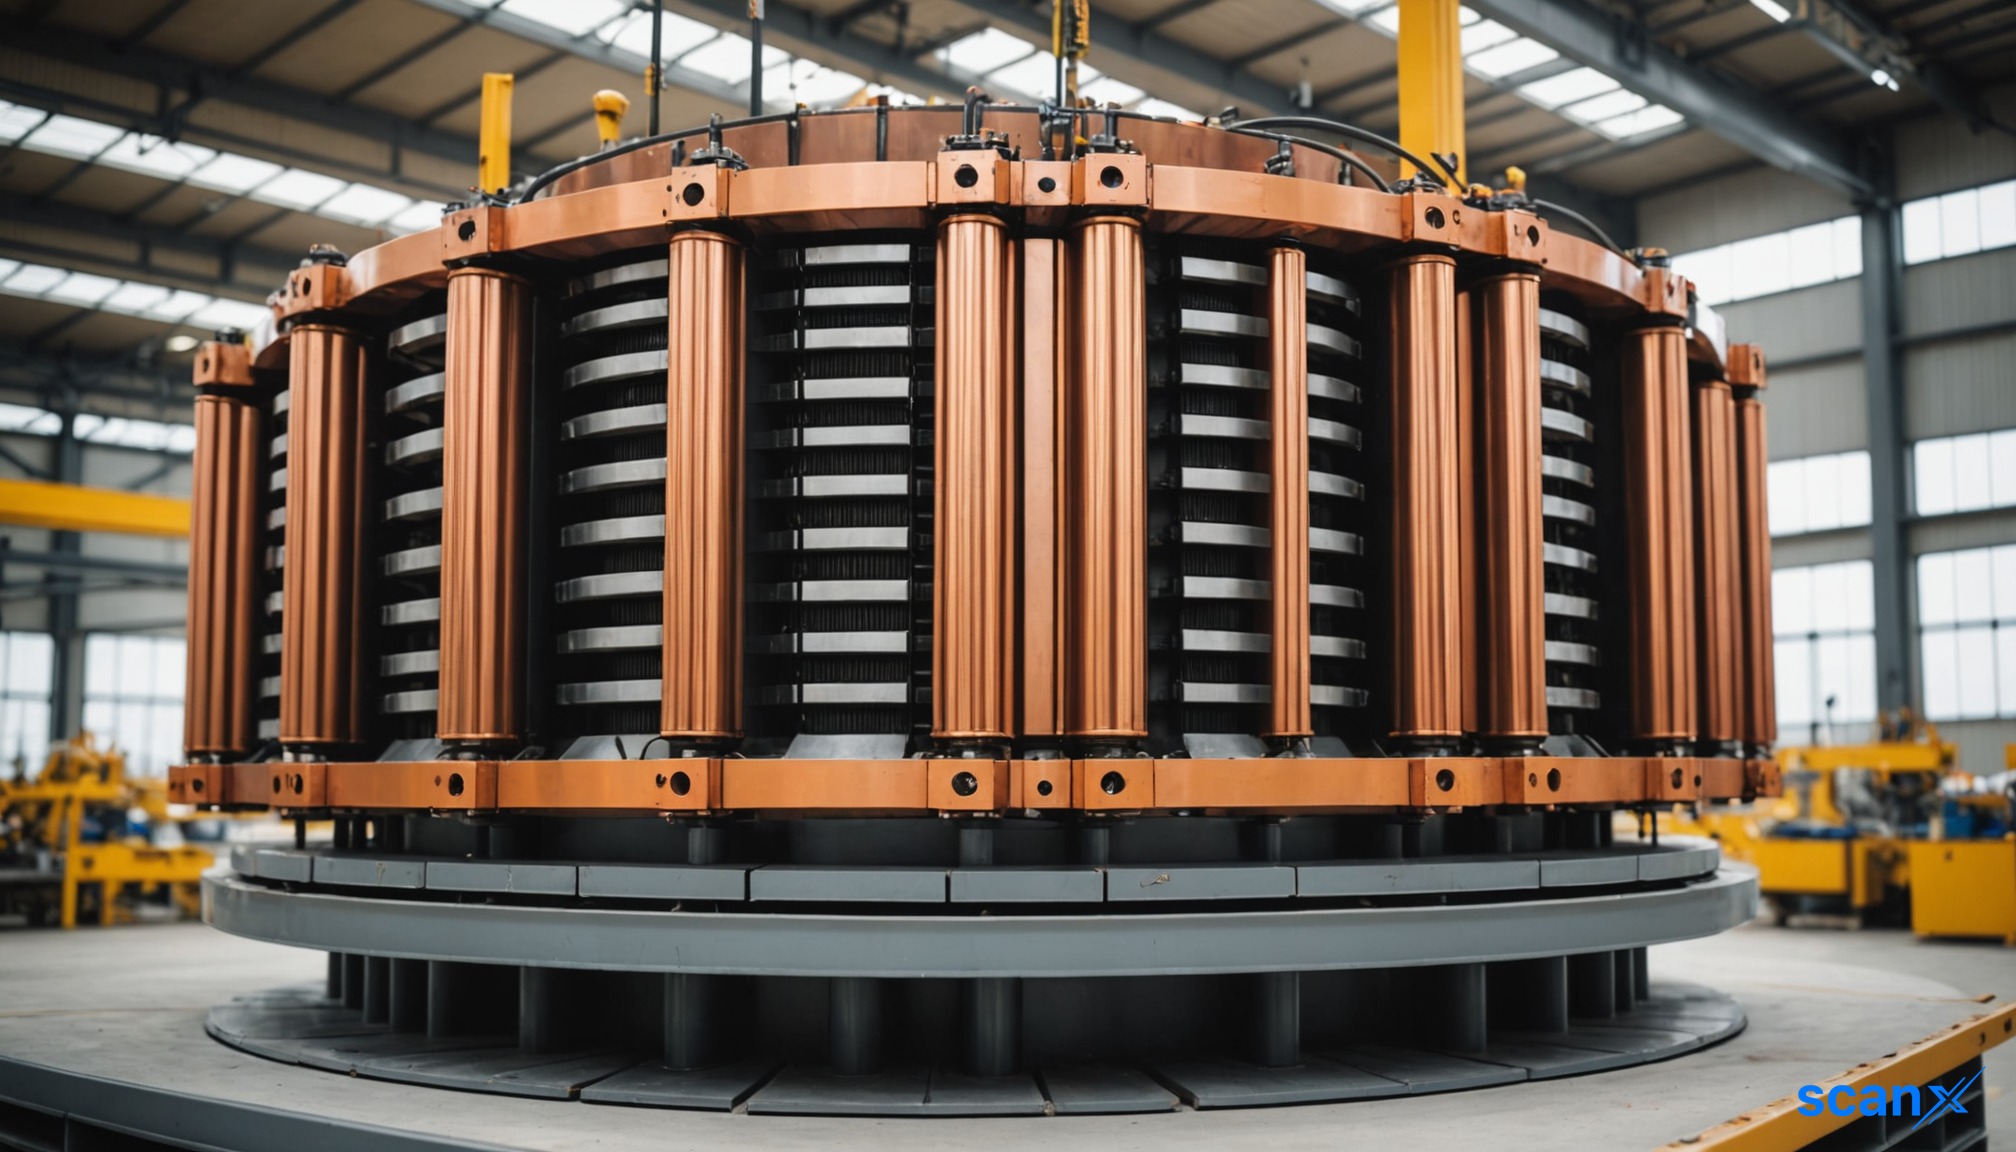
*this image is generated using AI for illustrative purposes only.
Indo Tech Transformers has secured a significant work order worth Rs 42.88 crore from Leap Green Energy Group. This latest deal adds to the company's growing order book in the current quarter.
The order terms specify the manufacture and supply of 2 transformers of 125 MVA each in the 400/33 kV voltage class for a Solar project for Magnolia Powertec Private Limited. Additionally, it includes 2 transformers of 125 MVA each in the 230/33 kV voltage class for a Wind project for Crocus Green Energy Private Limited. The value is exclusive of taxes.
ORDER IN FINANCIAL CONTEXT
The new Rs 42.88 crore order complements the previously disclosed Rs 165.55 crore order from Andhra Pradesh Transmission Corporation Limited (Ap transco) and two orders totaling Rs 109.00 crore from Waaree Renewable Technologies Limited. Combined, these contracts represent a substantial single-quarter inflow for the microcap firm. As the trailing twelve-month (TTM) revenue stands at Rs 0.0 crore, standard book-to-bill ratios cannot be computed. The total disclosed order book now includes deals from transmission utilities and multiple renewable energy developers, providing visibility into near-term execution pipelines.
COMPANY ORDER TRACK RECORD
Indo Tech Transformers has disclosed four orders in Q2FY27 (Jul-Sep 2026). The total order inflow for the quarter is Rs 317.43 crore. This highlights diversified demand from domestic entities across different energy segments.
| Quarter | Total Order Inflow (Rs Cr) | Order Count | Key Awarding Entities |
|---|---|---|---|
| Q2FY27 (Jul-Sep 2026) | 274.55 (3 orders) | Andhra Pradesh Transmission Corporation Limited (AP TRANSCO), WAAREE RENEWABLE TECHNOLOGIES LIMITED | Ap transco, Waaree Renewable Technologies Limited, Leap Green Energy Group |
EXECUTION AND REVENUE QUALITY
The company’s consolidated financials show zero revenue, net profit, and operating profit margin for the trailing twelve months. This indicates that no revenue has been recognized in the most recent period. Without positive revenue figures, it is not possible to assess whether existing backlog is converting to revenue at an improving rate. Upcoming quarterly results will indicate if these orders begin contributing to top-line growth.
| Quarter | Revenue (Rs Cr) | Net Profit (Rs Cr) | OPM (%) |
|---|---|---|---|
| TTM | 0.0 | 0.0 | 0.0% |
WORKING CAPITAL AND EXECUTION CAPACITY
Balance sheet and cashflow data are not provided in the input, so liquidity and working capital assessment cannot be performed. However, given the zero TTM revenue, the company may need to rely on internal reserves or external financing to fund the production costs associated with the combined Rs 317.43 crore order book. Monitoring future cashflow statements will be critical to understanding how efficiently the company converts orders into cash.
WHAT TO WATCH
- Execution timeline: Delivery schedules for the various transformer units will impact revenue recognition timing.
- Revenue recognition: With TTM revenue at zero, the first quarter showing income from these orders will be a key performance indicator.
- Working capital strain: Large transformer orders require significant upfront capital; monitor operating cashflow trends.
- Client diversification: The order book now includes Ap transco, Waaree Renewable Technologies, and Leap Green Energy Group, reducing reliance on single clients.
KEY OBSERVATIONS
- Order visibility: Four disclosed order wins in Q2FY27 totaling Rs 317.43 crore signal strong business activity.
- Revenue gap: Zero TTM revenue contrasts with strong historical growth; clarify if this reflects seasonality or structural changes.
- Valuation check (as of 23 Sep 2026): P/E of 35.1x against ROCE of 32.97%. At the time of this article, valuation was pricing in execution improvement not yet visible in return ratios. (P/E is price-derived and will change; ROCE is from audited financials)
- Promoter holding: Promoter stake decreased from 75.00% in Q4FY26 to 72.18% in Q1FY27, a 2.82 pp change. This exceeds the 2 pp threshold and warrants attention regarding promoter confidence or share pledging activities.
Historical Stock Returns for Indo Tech Transformers
| 1 Day | 5 Days | 1 Month | 6 Months | 1 Year | 5 Years |
|---|---|---|---|---|---|
| +5.00% | +1.85% | -10.90% | +202.98% | +103.16% | +2,076.59% |

 17
17









 Access 50+ Readymade Screeners
  Use 200+ Custom Filters
  Get Full Market Insights





