Indo Tech Transformers Q1FY27 Results: Net profit up 39% YoY

scanx
Reviewed by
Anirudha BScanX News Team
Key Highlights
  • Net profit rose 39% YoY to ₹26 crore in Q1FY27, driven by 38% sales growth to ₹227 crore
  • FY26 revenue reached ₹782 crore with PAT margin expanding 150 bps to 12%
  • Executable order book stands at ₹1,318 crore with pipeline opportunities over ₹10,000 crore
  • Phased capex of ₹495 crore targets 50,000 MVA capacity by FY29 using internal accruals
  • Debtor days improved to 56 days from 76 days, supporting strong cash reserves of ₹114 crore
powered bylight_fuzz_icon
50586730

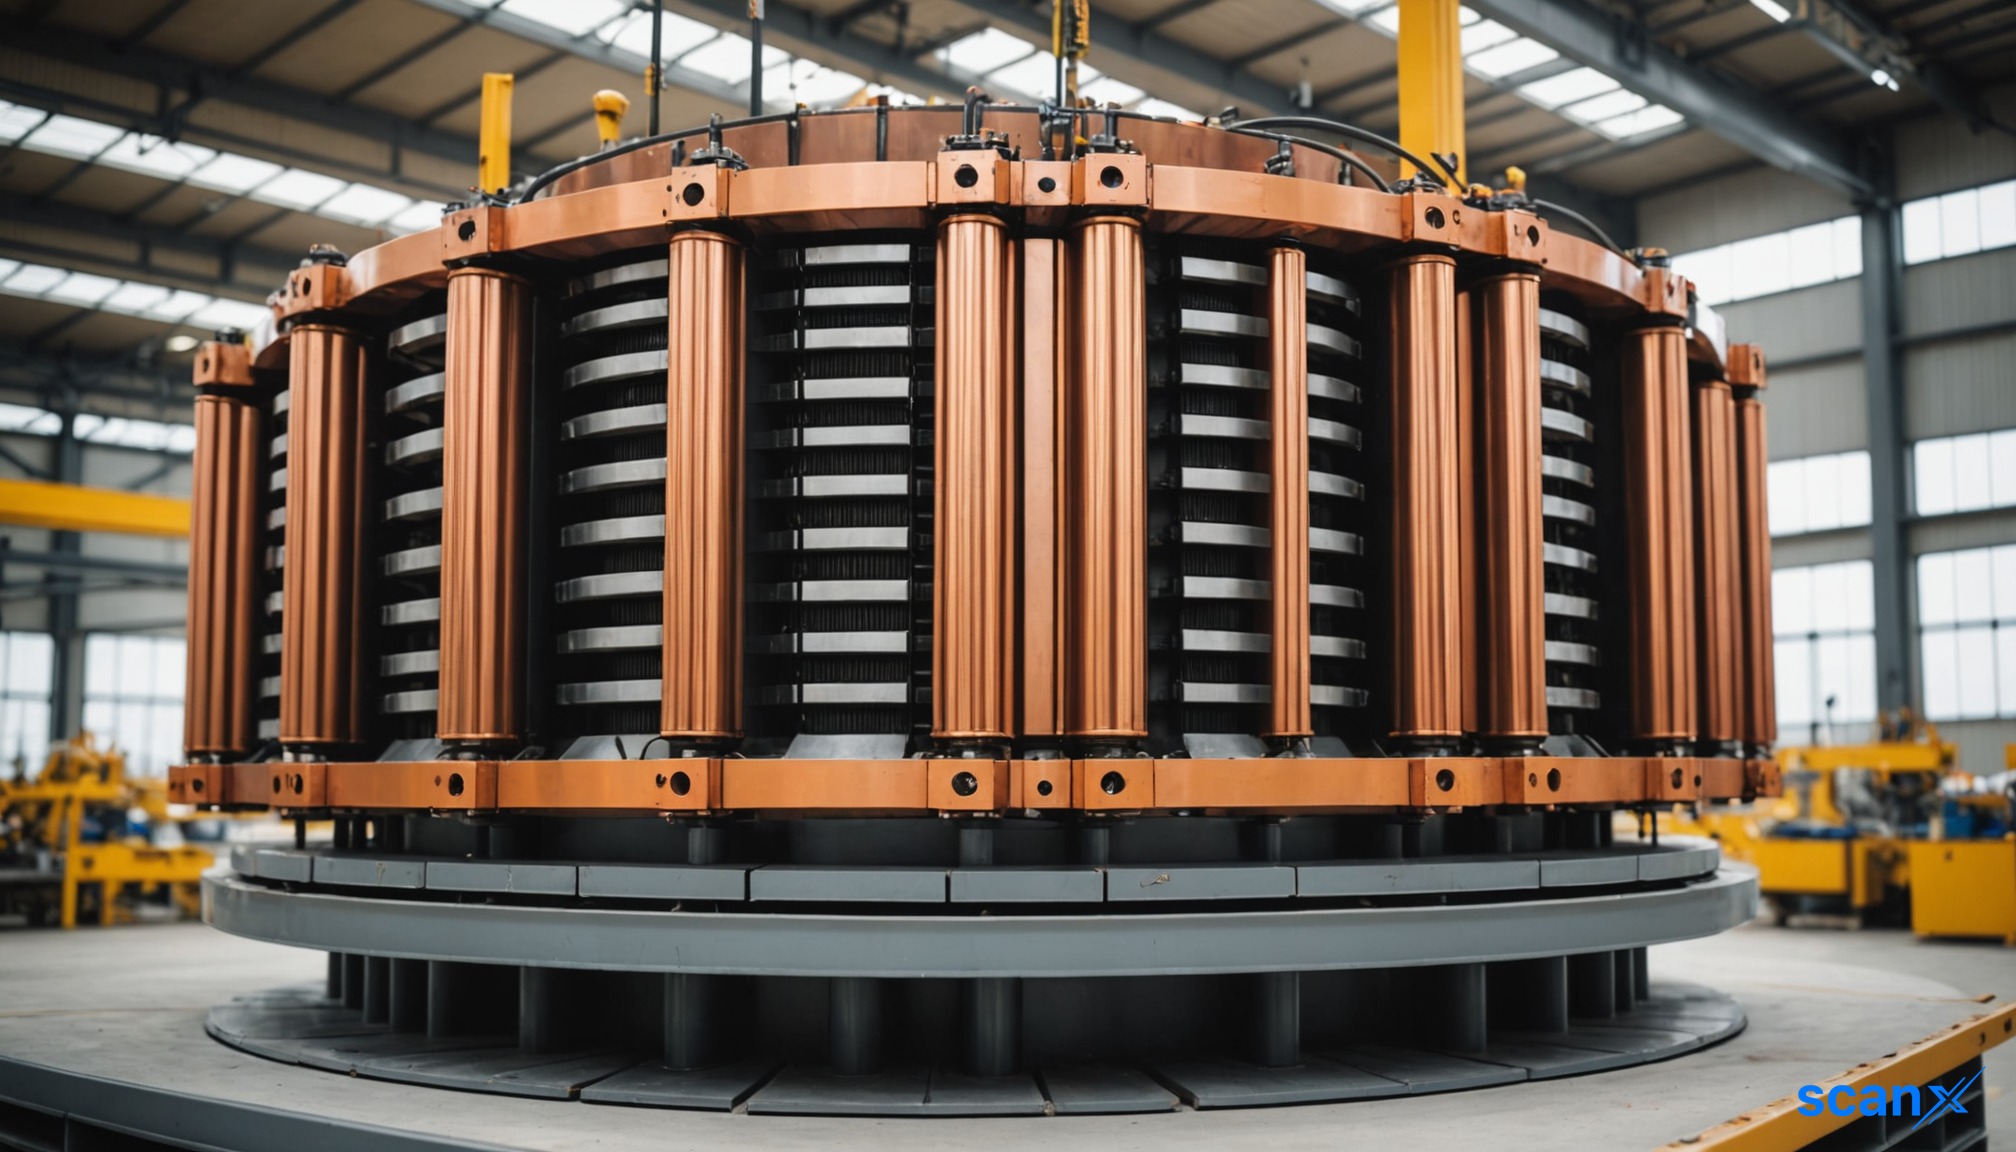
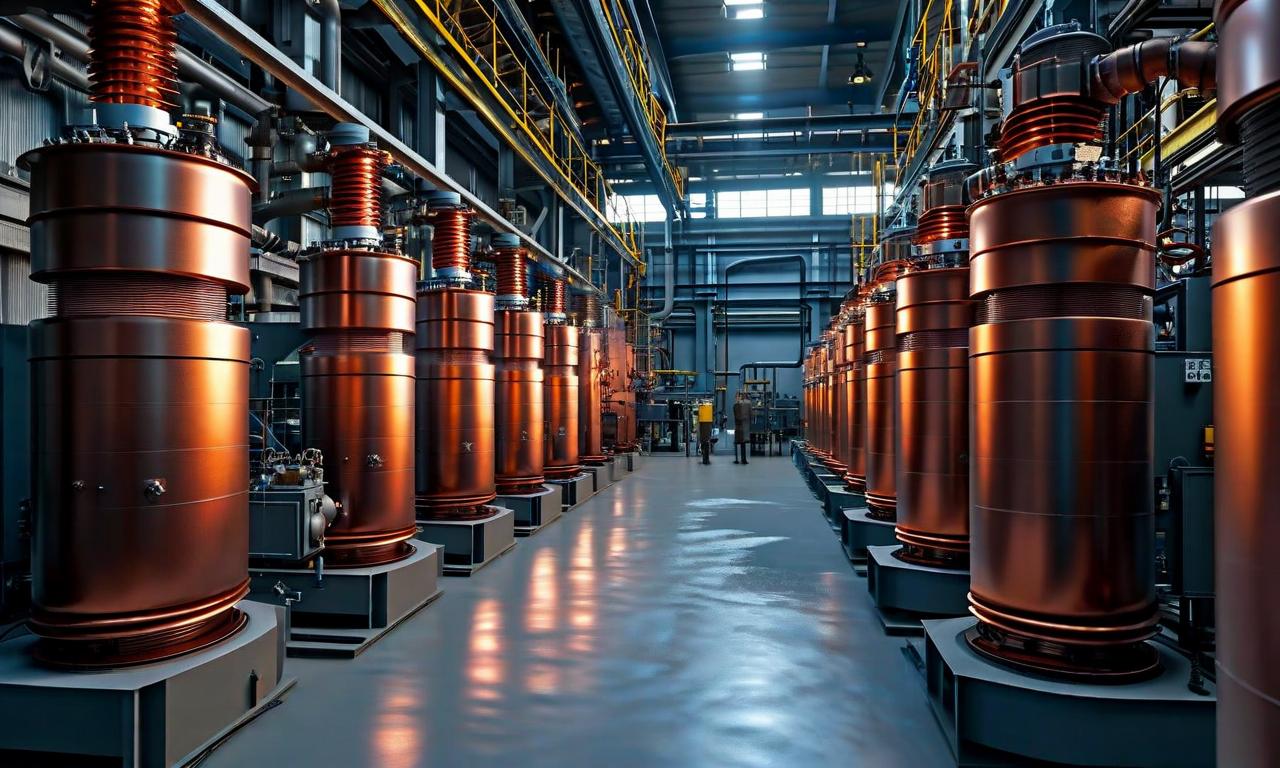
*this image is generated using AI for illustrative purposes only.

Indo Tech Transformers Limited reported a 39% year-on-year rise in net profit for the quarter ended June 30, 2026. Sales grew 38% to ₹227 crore, supported by strong order visibility and high capacity utilisation.

The subsidiary of Shirdi Sai Electricals Limited filed its investor presentation with the Bombay Stock Exchange and National Stock Exchange on September 10, 2026. The unaudited figures highlight continued momentum from the previous fiscal year.

Financial Performance

Revenue from operations reached ₹227 crore in Q1FY27, up from ₹164 crore in the same period last year. Profit before tax (PBT) increased 36% to ₹34 crore, while profit after tax (PAT) rose 39% to ₹26 crore.

Metric Q1 FY26 Q4 FY26 Q1 FY27 YoY Change
Sales (₹ Cr) 164 239 227 +38%
PBT (₹ Cr) 25 32 34 +36%
PAT (₹ Cr) 19 24 26 +39%

For the full fiscal year FY26, revenue stood at ₹782 crore, representing a 28% increase over FY25. PAT for FY26 was ₹93 crore, a 45% jump from ₹64 crore in the prior year. The PAT margin expanded by 150 basis points to 12%.

What the Numbers Show

The company’s balance sheet strength supports its expansion plans. Cash and bank balances increased to ₹114 crore from ₹93 crore in FY25. Total equity rose to ₹374 crore from ₹281 crore. Working capital efficiency improved significantly, with debtor days falling to 56 days from 76 days in FY25. This improvement in collections, alongside near-zero net debt and a debt-to-equity ratio of 0.03x, indicates robust liquidity ahead of capital expenditure cycles.

Capacity Expansion and Order Book

Indo Tech operates at 80-90% capacity utilisation against an installed capacity of 14,000 MVA. The company holds an executable order book of ₹1,318 crore and pipeline opportunities exceeding ₹10,000 crore.

A phased capital expenditure plan of ₹495 crore aims to expand capacity to 50,000 MVA by FY29. The expansion is funded through internal accruals and term loans without equity dilution. Key phases include:

  • Phase 1: Capacity to 16,000 MVA (₹75 crore)
  • Phase 2: Capacity to 20,000 MVA (₹25 crore)
  • Phase 3: Capacity to 25,000 MVA (₹35 crore)
  • Phase 4: Target 50,000 MVA by FY29 (₹360 crore)

Market Context

The Indian power transformer market is projected to grow from ₹16,063 crore in FY22 to ₹28,744 crore by FY30. Demand drivers include transmission infrastructure upgrades, renewable energy additions targeting 500 GW by 2030, and industrial capex in steel, cement, and data centres.

Indo Tech manufactures distribution, power, and special-application transformers, serving customers across utilities, renewable developers, and industrial sectors. The company has manufactured over 66,000 transformers since its inception.

Historical Stock Returns for Indo Tech Transformers

1 Day5 Days1 Month6 Months1 Year5 Years
-1.52%+0.70%-5.02%+172.70%+100.30%+2,105.33%

How will the phased capacity expansion to 50,000 MVA by FY29 impact Indo Tech's debt-to-equity ratio and interest coverage given the reliance on term loans?

What specific strategies is Indo Tech employing to maintain its 80-90% capacity utilization rate amidst the projected surge in domestic demand for renewable energy infrastructure?

Given the ₹10,000 crore pipeline opportunity, what percentage of this potential revenue is expected to come from the rapidly growing data center and industrial sectors versus traditional utilities?

like15
dislike

Indo Tech Transformers wins Rs 165.55 crore order from AP Transco

scanx
Reviewed by
Ritika DScanX News Team
Key Highlights
  • Indo Tech Transformers secured a Rs 165.55 crore order from Andhra Pradesh Transmission Corporation Limited (Ap transco).
  • The contract involves supplying 17 Nos. 80 MVA / 220/33 kV and 9 Nos. 80 MVA / 132/33 kV power transformers.
  • Delivery is scheduled from October 2026 to June 2027.
  • Total Q2FY27 order inflow rises to Rs 274.55 crore, including prior orders from Waaree Renewable Technologies.
  • TTM revenue remains at Rs 0.0 crore, limiting immediate book-to-bill analysis.
powered bylight_fuzz_icon
49723440

*this image is generated using AI for illustrative purposes only.

WHAT HAPPENED

Indo Tech Transformers has won a confirmed work order worth Rs 165.55 crore from Andhra Pradesh Transmission Corporation Limited (Ap transco). The contract covers the supply of 17 Nos. 80 MVA / 220/33 kV Power Transformer and 9 Nos. 80 MVA / 132/33 kV Power Transformer, with delivery scheduled from October 2026 to June 2027.

ORDER IN FINANCIAL CONTEXT

The new Rs 165.55 crore order adds to the previously disclosed Rs 55.0 crore and Rs 54.0 crore orders from Waaree Renewable Technologies Limited. Combined, these contracts represent a substantial single-quarter inflow for the microcap firm. As the trailing twelve-month (TTM) revenue stands at Rs 0.0 crore, standard book-to-bill ratios cannot be computed. The total disclosed order book now includes deals from both transmission and renewable energy clients, providing visibility into near-term execution pipelines.

COMPANY ORDER TRACK RECORD

Indo Tech Transformers has disclosed three orders in Q2FY27 (Jul-Sep 2026). The total order inflow for the quarter is Rs 274.55 crore, comprising the prior Rs 109.00 crore from Waaree Renewable Technologies Limited and the latest Rs 165.55 crore deal from Ap transco. This highlights diversified demand from domestic entities across different energy segments.

Quarter Total Order Inflow (Rs Cr) Order Count Key Awarding Entities
Q2FY27 (Jul-Sep 2026) 109.00 (2 orders) WAAREE RENEWABLE TECHNOLOGIES LIMITED Ap transco, Waaree Renewable Technologies Limited

EXECUTION AND REVENUE QUALITY

The company’s consolidated financials show zero revenue, net profit, and operating profit margin for the trailing twelve months. This indicates that no revenue has been recognized in the most recent period, possibly due to project timing or accounting policies. Without positive revenue figures, it is not possible to assess whether existing backlog is converting to revenue at an improving rate. Upcoming quarterly results will indicate if these orders begin contributing to top-line growth.

Quarter Revenue (Rs Cr) Net Profit (Rs Cr) OPM (%)
TTM 0.0 0.0 0.0%

WORKING CAPITAL AND EXECUTION CAPACITY

Balance sheet and cashflow data are not provided in the input, so liquidity and working capital assessment cannot be performed. However, given the zero TTM revenue, the company may need to rely on internal reserves or external financing to fund the production costs associated with the combined Rs 274.55 crore order book. Monitoring future cashflow statements will be critical to understanding how efficiently the company converts orders into cash.

WHAT TO WATCH

  • Execution timeline: Delivery for the new order is scheduled for October 2026 to June 2027; delays could impact revenue recognition schedules.
  • Revenue recognition: With TTM revenue at zero, the first quarter showing income from these orders will be a key performance indicator.
  • Working capital strain: Large transformer orders require significant upfront capital; monitor operating cashflow trends.
  • Client diversification: The order book now includes both Ap transco and Waaree Renewable Technologies, reducing reliance on a single client.

KEY OBSERVATIONS

  • Order visibility: Three disclosed order wins in Q2FY27 totaling Rs 274.55 crore signal strong business activity.
  • Revenue gap: Zero TTM revenue contrasts with strong historical growth; clarify if this reflects seasonality or structural changes.
  • Valuation check (as of 02 Sep 2026): P/E of 39.6x against ROCE of 32.97%. At the time of this article, valuation was pricing in execution improvement not yet visible in return ratios. (P/E is price-derived and will change; ROCE is from audited financials)
  • Promoter holding: Promoter stake decreased from 75.00% in Q4FY26 to 72.18% in Q1FY27, a 2.82 pp change. This exceeds the 2 pp threshold and warrants attention regarding promoter confidence or share pledging activities.

Historical Stock Returns for Indo Tech Transformers

1 Day5 Days1 Month6 Months1 Year5 Years
-1.52%+0.70%-5.02%+172.70%+100.30%+2,105.33%
like19
dislike

More News on Indo Tech Transformers

1 Year Returns:+100.30%