Indiqube Spaces Q1 Results: Loss widens to ₹238.8 crore, revenue up 36%

2 min read     Updated on 12 Aug 2026, 11:50 PM
scanx
Reviewed by
Ashish TScanX News Team
AI Summary

Indiqube Spaces posted a Q1FY26 net loss of ₹238.82 crore, wider than the ₹226.52 crore loss in Q4FY25, despite revenue jumping 36.7% YoY to ₹4,226.85 crore. High depreciation (₹1,878.93 crore) and finance costs (₹1,272.19 crore) weighed on margins. The company has deployed ₹2,690.37 million of its IPO proceeds toward centre expansion and debt reduction, with ₹3,354.22 million remaining unutilised.

powered bylight_fuzz_icon
48104431

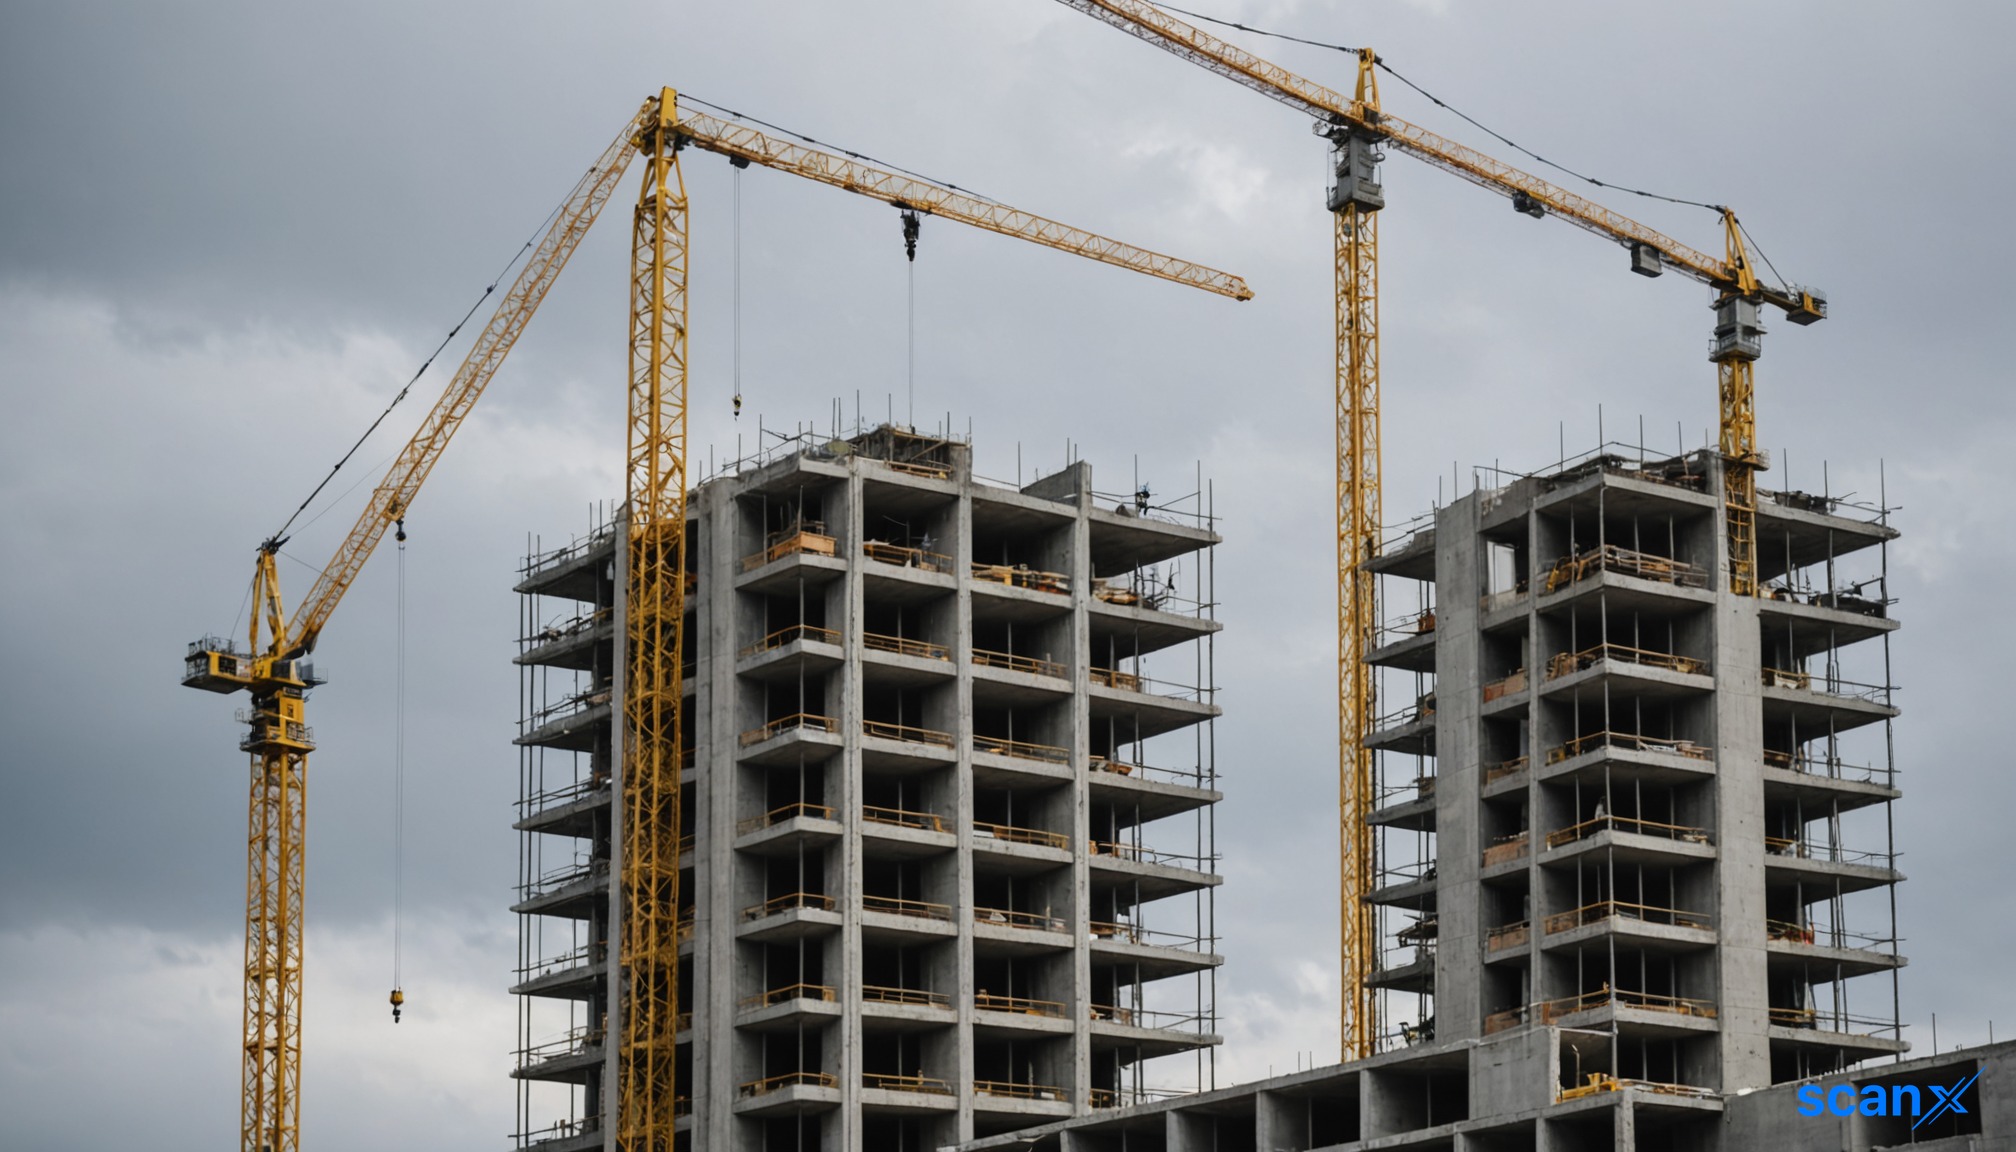
*this image is generated using AI for illustrative purposes only.

Indiqube Spaces reported a net loss of ₹238.82 crore for the quarter ended June 30, 2026, compared to a loss of ₹226.52 crore in the previous quarter. The company’s revenue from operations rose to ₹4,226.85 crore, marking a significant increase from ₹3,092.93 crore in the same period last year.

The Board of Directors, in a meeting held on August 12, 2026, approved the unaudited financial results for Q1FY26. The results were reviewed by statutory auditors Walker Chandiok & Co LLP, which issued an unmodified opinion. The company operates primarily in the leasing of managed commercial workspaces.

Financial Performance Overview

Revenue growth was accompanied by higher operating expenses, particularly in depreciation and finance costs. Total expenses stood at ₹4,793.24 crore, exceeding total income of ₹4,488.14 crore. This resulted in a loss before tax of ₹305.10 crore, compared to ₹238.95 crore in the prior quarter and ₹499.63 crore in Q1FY25.

Metric: Q1FY26 (Unaudited) Q4FY25 (Unaudited) Q1FY25 (Unaudited)
Revenue from operations: ₹4,226.85 crore ₹4,014.47 crore ₹3,092.93 crore
Total income: ₹4,488.14 crore ₹4,257.13 crore ₹3,241.25 crore
Total expenses: ₹4,793.24 crore ₹4,496.08 crore ₹3,740.88 crore
Loss before tax: ₹305.10 crore ₹238.95 crore ₹499.63 crore
Net loss after tax: ₹238.82 crore ₹226.52 crore ₹367.55 crore
EPS (Basic/Diluted): ₹(1.13) ₹(1.07) ₹(2.01)

Other income contributed ₹261.29 crore, up from ₹242.66 crore in the previous quarter and ₹148.32 crore in Q1FY25. Finance costs increased to ₹1,272.19 crore from ₹1,192.03 crore in Q4FY25. Depreciation and amortisation expense remained the largest cost component at ₹1,878.93 crore.

What the Numbers Show

The divergence between revenue growth and profit improvement highlights the capital-intensive nature of Indiqube Spaces’ business model. While revenue expanded by over ₹1,100 crore year-on-year, depreciation costs alone consumed nearly 44% of total revenue. This structural cost pressure is typical for asset-heavy workspace providers scaling their footprint, where fixed asset investments drive high amortisation charges before stabilising into steady-state profitability.

IPO Proceeds Utilisation

The company has utilised ₹2,690.37 million of its IPO proceeds as of June 30, 2026, against a revised plan of ₹6,044.59 million. Key allocations include:

  • New centre establishment: ₹1,276.28 million utilised out of ₹2,756.49 million planned
  • Debt repayment: ₹913.40 million fully utilised
  • General corporate purposes: ₹500.69 million utilised out of ₹504.70 million planned

Unutilised proceeds of ₹3,354.22 million are temporarily held in bank deposits. The Board had earlier sought shareholder approval via postal ballot on June 24, 2026, to vary the objects of utilisation, including new allocations for security deposits, fit-outs, renewable power infrastructure, and strategic real estate opportunities.

Historical Stock Returns for Indiqube Spaces

1 Day5 Days1 Month6 Months1 Year5 Years
-0.14%+6.90%+4.99%+1.05%-13.30%-15.68%

How will the proposed reallocation of unutilized IPO proceeds toward renewable power infrastructure impact Indiqube Spaces' long-term operational costs and ESG compliance?

Given the high depreciation burden consuming nearly 44% of revenue, what is the projected timeline for the company to reach steady-state profitability as its asset base matures?

Will the continued rise in finance costs, now exceeding ₹1,272 crore, necessitate further debt restructuring or equity dilution to maintain healthy leverage ratios?

Indiqube Spaces Q1FY27 PAT rises 91% to ₹35 crore; revenue hits record

3 min read     Updated on 12 Aug 2026, 11:22 PM
scanx
Reviewed by
Anirudha BScanX News Team
AI Summary

Indiqube Spaces reported record Q1FY27 revenue of ₹428 crore, up 37% YoY, and an IGAAP-equivalent PAT of ₹35 crore, up 91%. Statutory net loss narrowed to ₹239 crore from ₹368 crore. Operational metrics showed steady-state occupancy at 90% and VAS contribution rising to 17% of revenue.

powered bylight_fuzz_icon
48097370

*this image is generated using AI for illustrative purposes only.

Indiqube Spaces delivered its highest-ever quarterly revenue in Q1FY27, reporting ₹428 crore, a 37% year-on-year growth from ₹313 crore in the corresponding period last year. The integrated managed spaces platform also saw its net profit after tax (PAT) surge 91% to ₹35 crore on an IGAAP-equivalent basis, up from ₹18.5 crore in Q1FY26. This performance underscores the company’s ability to scale profitability alongside top-line expansion.

The results were driven by strong operating leverage. EBITDA increased 34% to ₹87 crore, maintaining a healthy margin of 20%. EBIT grew even faster at 59% to ₹55 crore. The company’s leadership attributed this momentum to improving utilization across the portfolio and a richer mix of value-added services.

Operational Metrics

Occupancy levels strengthened during the quarter, reflecting robust customer demand. Steady-state occupancy—defined as the occupancy of mature centers older than 12 months—reached 90%. Overall occupancy improved to 86%.

Value-added services (VAS) continued to scale rapidly, contributing significantly to the revenue mix. VAS revenue reached ₹72 crore, increasing its contribution to operating revenue from 11% in Q1FY26 to 17% in Q1FY27. This shift indicates a deepening engagement with existing clients beyond basic workspace rentals.

Financial Performance

Metric Q1FY27 Q1FY26 YoY Change
Revenue ₹428 crore ₹313 crore +37%
Recurring Revenue ₹395 crore ₹307 crore +29%
One-Time Revenue ₹33 crore ₹7 crore N/A
EBITDA ₹87 crore ₹65 crore +34%
EBITDA Margin 20% 21% -100 bps
PAT (IGAAP Eq.) ₹35 crore ₹18.5 crore +91%
PAT Margin 8% 6% +200 bps

Recurring revenue constituted the bulk of the top line at ₹395 crore, up from ₹307 crore year-ago. One-time revenue, largely project-based, rose to ₹33 crore from ₹7 crore, supported by ongoing engagements in design and build solutions.

What the Numbers Show

A key analytical observation is the divergence between Ind AS-reported profitability and IGAAP-equivalent metrics due to lease accounting standards. Under Ind AS 116, the company reported a loss before tax of (₹30 crore) and a loss after tax of (₹24 crore). However, on an IGAAP-equivalent basis—which excludes non-cash depreciation on right-of-use (ROU) assets and interest on lease liabilities—the company posted a profit before tax of ₹43 crore and PAT of ₹35 crore.

The total impact of Ind AS 116 adjustments (depreciation on ROU assets plus interest on lease liabilities) amounted to ₹264 crore in Q1FY27, compared to ₹213 crore in Q1FY26. This highlights that the underlying cash-generating capability of the business remains strong despite accounting losses. Adjusted Cash EBIT, which adds back finance lease income to Cash EBIT, stood at ₹75 crore, representing an 18% margin on revenue from operations, up from 17% in the prior quarter.

Statutory reporting figures further illustrate this accounting impact. The company reported a statutory net loss of ₹239 crore for Q1FY27, a significant improvement from the ₹368 crore loss recorded in Q1FY26. While the absolute loss remains substantial due to lease accounting, the narrowing gap between the two periods aligns with the expansion in operational profitability metrics like EBITDA and IGAAP-equivalent PAT.

Balance Sheet and Lease Liabilities

The company clarified that lease liabilities should not be viewed as traditional debt when calculating debt-equity ratios, as they represent future rent payments under long-term landlord contracts rather than borrowings. The average client lock-in period is approximately 3.5 years, aligned with capex payback cycles. IndiQube maintains a portfolio of 10.61 million sq ft under management, with 9.66 million sq ft being rent-paying area.

Historical Stock Returns for Indiqube Spaces

1 Day5 Days1 Month6 Months1 Year5 Years
-0.14%+6.90%+4.99%+1.05%-13.30%-15.68%

How will the increasing reliance on Ind AS 116 adjustments impact investor perception and valuation multiples compared to peers using different accounting treatments?

Can IndiQube sustain the current 90% steady-state occupancy rate as new supply enters the market, or is there a risk of margin compression due to competitive pricing?

What specific strategies is IndiQube employing to further increase the contribution of value-added services beyond the current 17% to drive higher-margin recurring revenue?

More News on Indiqube Spaces

1 Year Returns:-13.30%