

ITDC Q1FY27 revenue rises to ₹886 crore, net profit dips YoY


ITDC's Q1FY27 results show revenue growth but a dip in net profit. Standalone revenue rose to ₹886.34 crore, while net profit declined to ₹99.43 crore. Consolidated revenue was ₹901.04 crore with net profit at ₹93.92 crore. Pre-tax profits improved, but post-tax figures contracted.


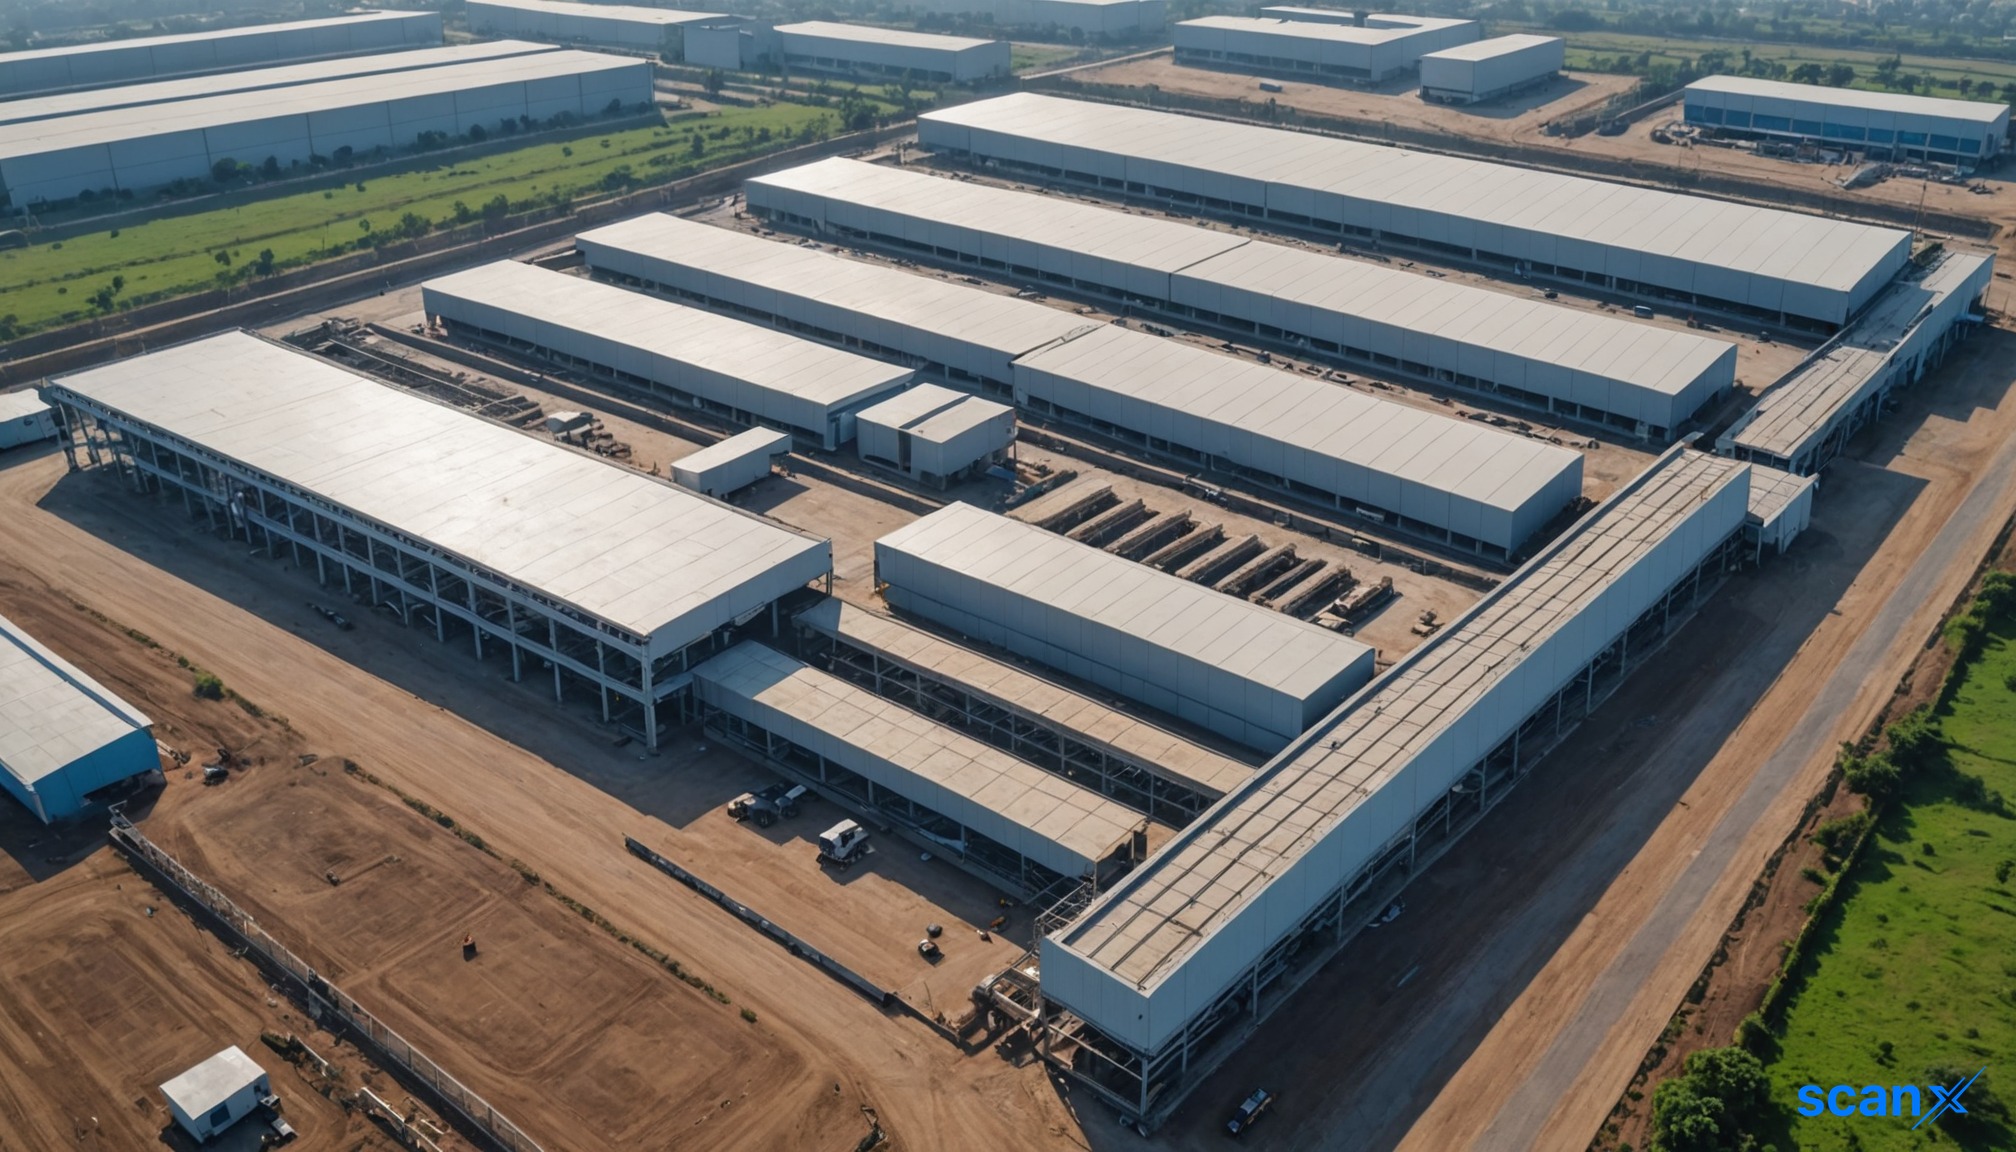
*this image is generated using AI for illustrative purposes only.
India Tourism Development Corporation reported a mixed financial performance for the first quarter of FY27, with revenue growing year-on-year while net profit contracted slightly due to rising operating costs. The Government of India undertaking posted standalone revenue from operations of ₹8,863.37 lakh for the quarter ended June 30, 2026, an increase from ₹8,641.35 lakh in the corresponding period last year. Despite the top-line growth, standalone net profit after tax declined to ₹994.31 lakh, down from ₹1,019.62 lakh in Q1FY26. The Board of Directors approved the unaudited standalone and consolidated financial results on August 10, 2026, pursuant to Regulation 33 of the SEBI (Listing Obligations and Disclosure Requirements) Regulations, 2015.
Revenue and Profitability Overview
The company’s total income from operations rose modestly, driven by continued business activity in its travel, tourism, and hospitality segments. Standalone other income also increased to ₹754.56 lakh from ₹606.35 lakh a year ago, contributing to a total income of ₹9,617.93 lakh. However, profitability metrics showed compression. Net profit before tax stood at ₹1,427.21 lakh, compared to ₹1,290.11 lakh in Q1FY25, indicating that pre-tax earnings improved but tax provisions or other adjustments led to a lower bottom line.
On a consolidated basis, revenue from operations reached ₹9,010.38 lakh, up from ₹8,774.83 lakh in the prior year. Consolidated net profit after tax was ₹939.23 lakh, down from ₹974.59 lakh in Q1FY26. The divergence between pre-tax and post-tax figures suggests higher effective tax rates or specific non-operational deductions impacting the final net profit.
| Metric (Standalone) | Q1FY27 (Unaudited) | Q1FY26 (Unaudited) |
|---|---|---|
| Revenue from Operations | ₹8,863.37 lakh | ₹8,641.35 lakh |
| Other Income | ₹754.56 lakh | ₹606.35 lakh |
| Net Profit Before Tax | ₹1,427.21 lakh | ₹1,290.11 lakh |
| Net Profit After Tax | ₹994.31 lakh | ₹1,019.62 lakh |
| EPS (Basic & Diluted) | ₹1.16 | ₹1.19 |
Consolidated Performance and Key Metrics
Consolidated results reflect the performance of ITDC along with its subsidiaries. Total consolidated income was ₹9,724.78 lakh, compared to ₹9,339.92 lakh in Q1FY26. The consolidated net profit before tax was ₹1,368.64 lakh, up from ₹1,251.97 lakh previously. However, the final net profit after tax dipped to ₹939.23 lakh from ₹974.59 lakh. Earnings per share (EPS) on a consolidated basis decreased to ₹1.09 from ₹1.14 in the year-ago quarter.
The company’s paid-up equity share capital remained unchanged at ₹8,576.94 lakh. Reserves (excluding revaluation reserve) stood at ₹37,584.17 lakh for standalone operations and ₹33,697.45 lakh on a consolidated basis as of March 31, 2026.
What the Numbers Show
While ITDC managed to grow its top line by approximately 2.6% year-on-year, the inability to translate this into higher net profits highlights margin pressures. The pre-tax profit actually increased both on standalone and consolidated bases, suggesting operational efficiencies or volume gains. However, the post-tax decline indicates that tax liabilities or exceptional items absorbed the gains. Investors should monitor whether this is a one-time tax effect or a structural change in cost dynamics. The company has also reminded shareholders about unclaimed dividends for FY2017-18 through FY2024-25, urging them to claim amounts before shares are transferred to the Investor Education and Protection Fund (IEPF).
Regulatory Disclosures
The financial results were prepared in accordance with Indian Accounting Standards (IND AS) as prescribed under Section 133 of the Companies Act, 2013. The Audit Committee reviewed the results before they were placed before the Board of Directors. The full format of the quarterly results is available on the stock exchange websites (BSE and NSE) and the company’s website at www.itdc.co.in . The newspaper advertisements pertaining to these results were published on August 11, 2026, in The Indian Express (Delhi and Mumbai editions), Financial Express (Chennai edition), and Jansatta (Delhi edition), in compliance with Regulation 47 of the SEBI LODR Regulations.
Historical Stock Returns for India Tourism Development Corporation
| 1 Day | 5 Days | 1 Month | 6 Months | 1 Year | 5 Years |
|---|---|---|---|---|---|
| -0.88% | -0.45% | -3.20% | +5.71% | +9.67% | +58.77% |

What specific operational cost drivers are expected to persist in Q2FY27, and how will management mitigate these margin pressures?
Is the divergence between pre-tax growth and post-tax decline primarily due to one-time tax adjustments or a structural increase in effective tax rates?
How will the upcoming festive travel season impact ITDC's revenue trajectory given the current modest top-line growth trends?
 17
17






 Create Custom Screeners
  Access 200+ Pre-built Filters
  Use 50+ Readymade Screener





