Great Eastern Shipping Company reported a consolidated net profit of Rs. 2942.52 crores for the financial year ended March 31, 2026, compared to Rs. 2344.26 crores in the previous year. The Board of Directors approved the audited financial results (Standalone and Consolidated) for the quarter and year ended March 31, 2026, at their meeting held on May 14, 2026. Total income for the year stood at Rs. 6312.42 crores, against Rs. 6156.88 crores in the prior year. For the quarter ended March 31, 2026, the company posted a net profit of Rs. 1044.09 crores on total income of Rs. 1857.23 crores. The Statutory Auditors, Deloitte Haskins & Sells LLP, issued an Audit Report with an unmodified opinion on the audited financial results.
Consolidated Financial Performance
The following table summarises the consolidated financial results for the year and quarter ended March 31, 2026:
| Metric: |
Q4 FY26 (Rs. in crores) |
Q4 FY25 (Rs. in crores) |
FY26 (Rs. in crores) |
FY25 (Rs. in crores) |
| Revenue from Operations: |
1511.40 |
1223.04 |
5409.09 |
5322.54 |
| Total Income: |
1857.23 |
1373.24 |
6312.42 |
6156.88 |
| Profit for the Period: |
1044.09 |
363.09 |
2942.52 |
2344.26 |
| Total Equity: |
— |
— |
16819.72 |
14116.39 |
| Basic EPS (Rs.): |
72.98 |
25.38 |
205.69 |
163.87 |
On a standalone basis, the company reported a net profit of Rs. 2356.46 crores for the year ended March 31, 2026, compared to Rs. 2166.25 crores in the previous year. Standalone total income for the year was Rs. 4420.33 crores. The standalone earnings per share (basic) stood at Rs. 165.06 for the year. The consolidated net worth of the company stood at Rs. 16819.72 crores as at March 31, 2026, up from Rs. 14116.39 crores in the previous year.
Normalised Financial Highlights
The investor presentation also provides normalised financial metrics, which adjust for the impact of exchange rate movements on foreign currency loans and current assets and liabilities, as well as tax reversals and impairments. The table below presents select normalised key financial highlights:
| Key Financial Highlights: |
Q4 FY26 |
Q4 FY25 |
FY26 |
FY25 |
| Return on Equity (Consolidated): |
21% |
12% |
17% |
18% |
| Return on Capital Employed (Consolidated): |
20% |
11% |
16% |
16% |
| Gross Debt/Equity (x) (Consolidated): |
0.09 |
0.18 |
0.09 |
0.18 |
| Earning Per Share — INR/Share (Consolidated): |
61.67 |
29.97 |
188.29 |
170.67 |
| Cash Profit Per Share — INR/Share (Consolidated): |
77.21 |
49.20 |
250.57 |
231.91 |
| Dividend Per Share — INR/Share: |
11.70 |
5.40 |
35.10 |
29.70 |
| NAV Per Share — INR/Share (Consolidated): |
1,772–1,821 |
1,378–1,435 |
1,772–1,821 |
1,378–1,435 |
Segment-Wise Performance
The company operates across two segments — Shipping and Offshore. The table below presents the segment-wise revenue and results for the year ended March 31, 2026:
| Segment: |
Revenue FY26 (Rs. in crores) |
Revenue FY25 (Rs. in crores) |
Results FY26 (Rs. in crores) |
Results FY25 (Rs. in crores) |
| Shipping: |
4831.82 |
4860.98 |
2463.04 |
2078.73 |
| Offshore: |
1522.43 |
1330.31 |
479.48 |
265.53 |
| Total: |
6312.42 |
6156.88 |
2942.52 |
2344.26 |
The Offshore segment recorded revenue of Rs. 1522.43 crores for the year, compared to Rs. 1330.31 crores in the prior year, while segment results improved to Rs. 479.48 crores from Rs. 265.53 crores. Total consolidated assets stood at Rs. 19460.16 crores as at March 31, 2026, against Rs. 17655.66 crores in the previous year.
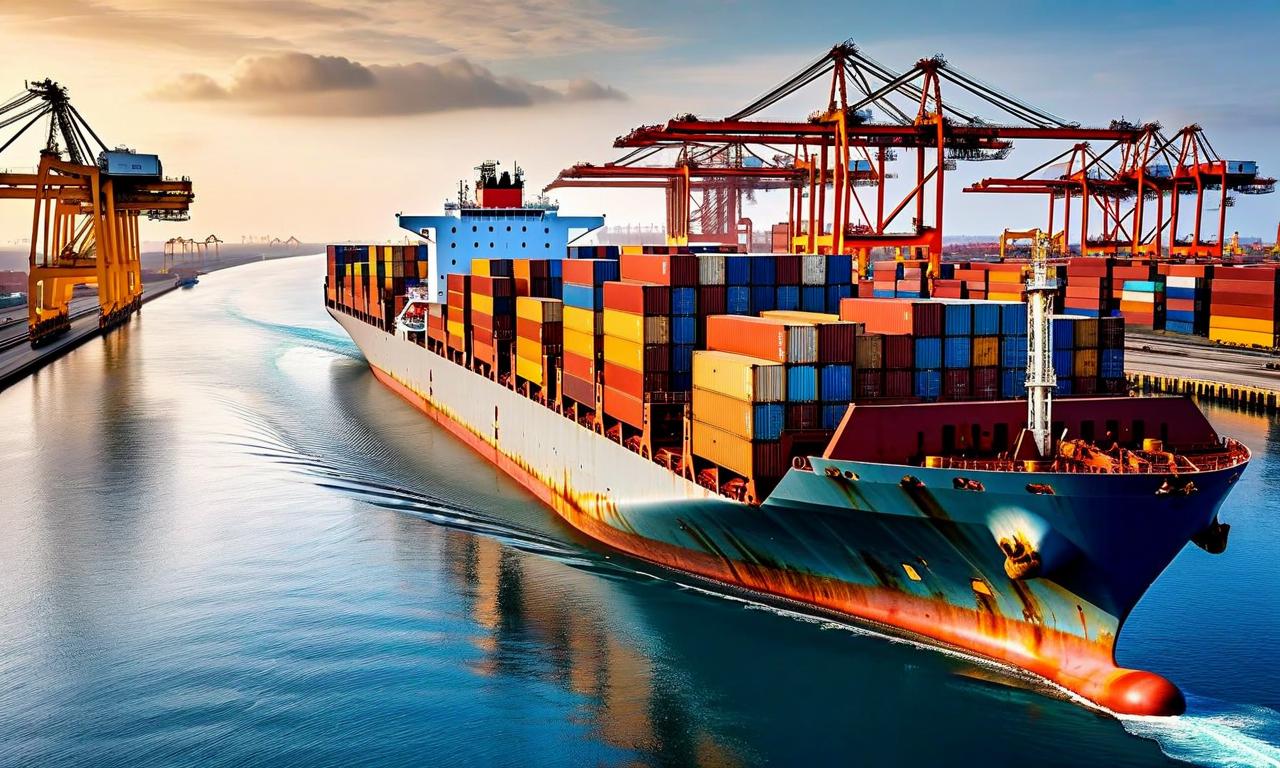
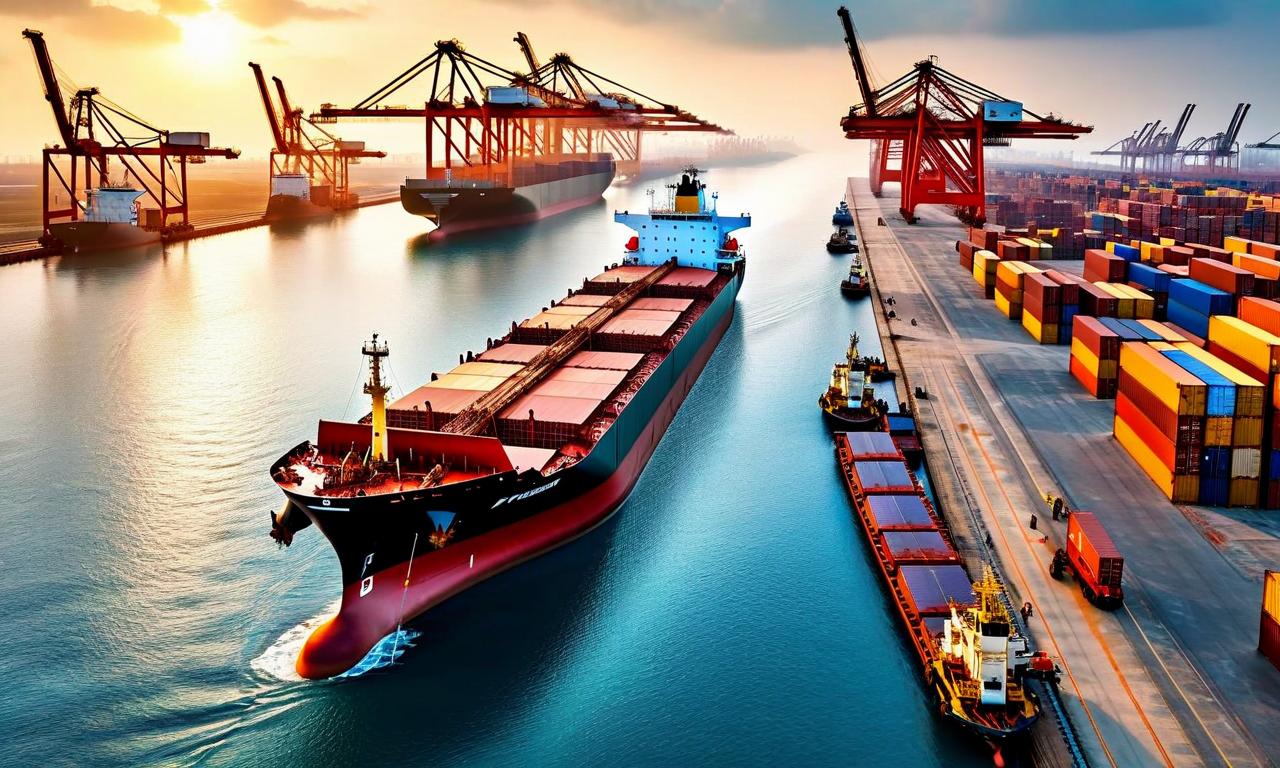
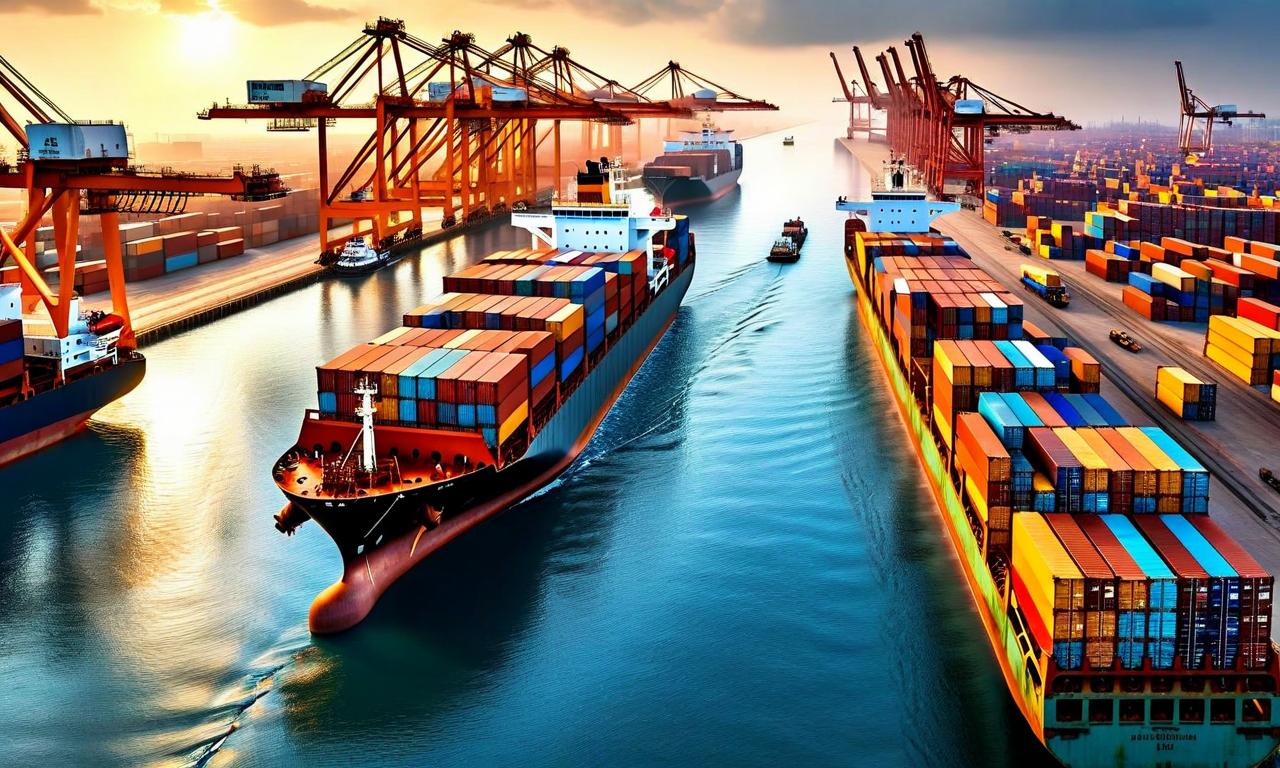
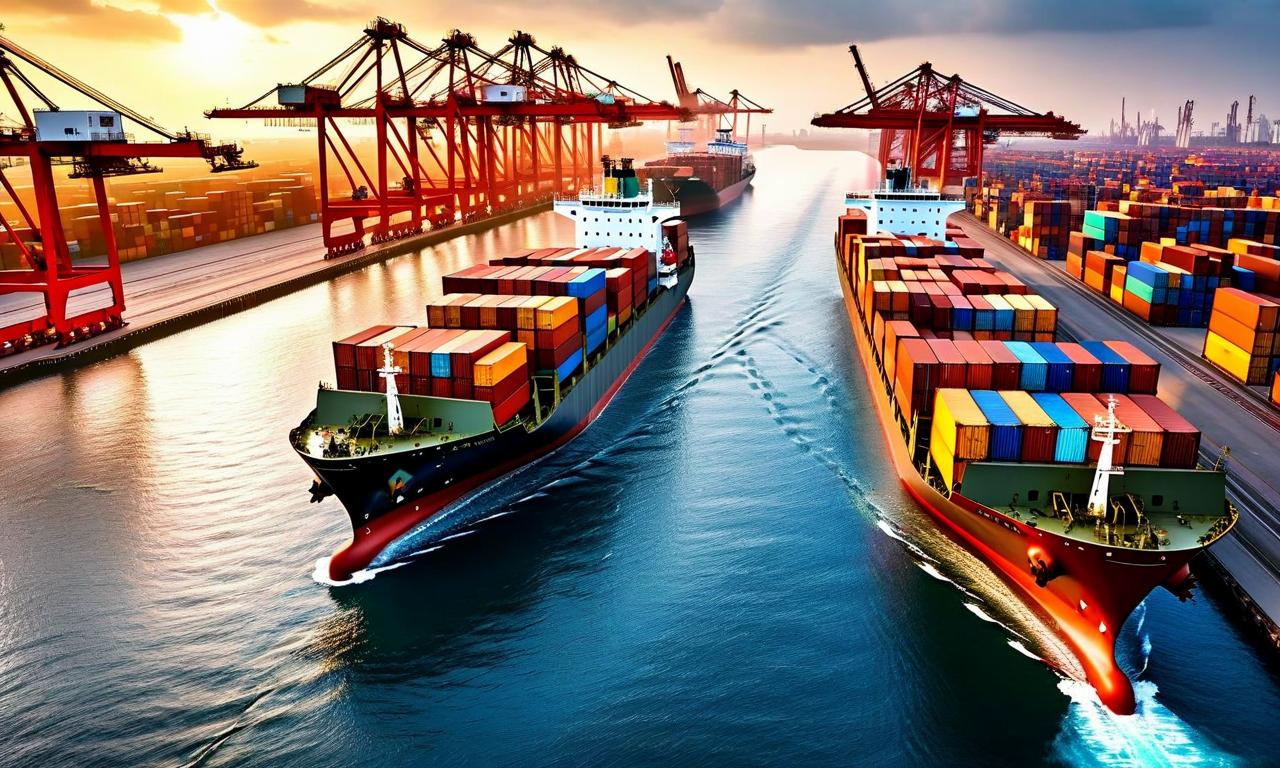
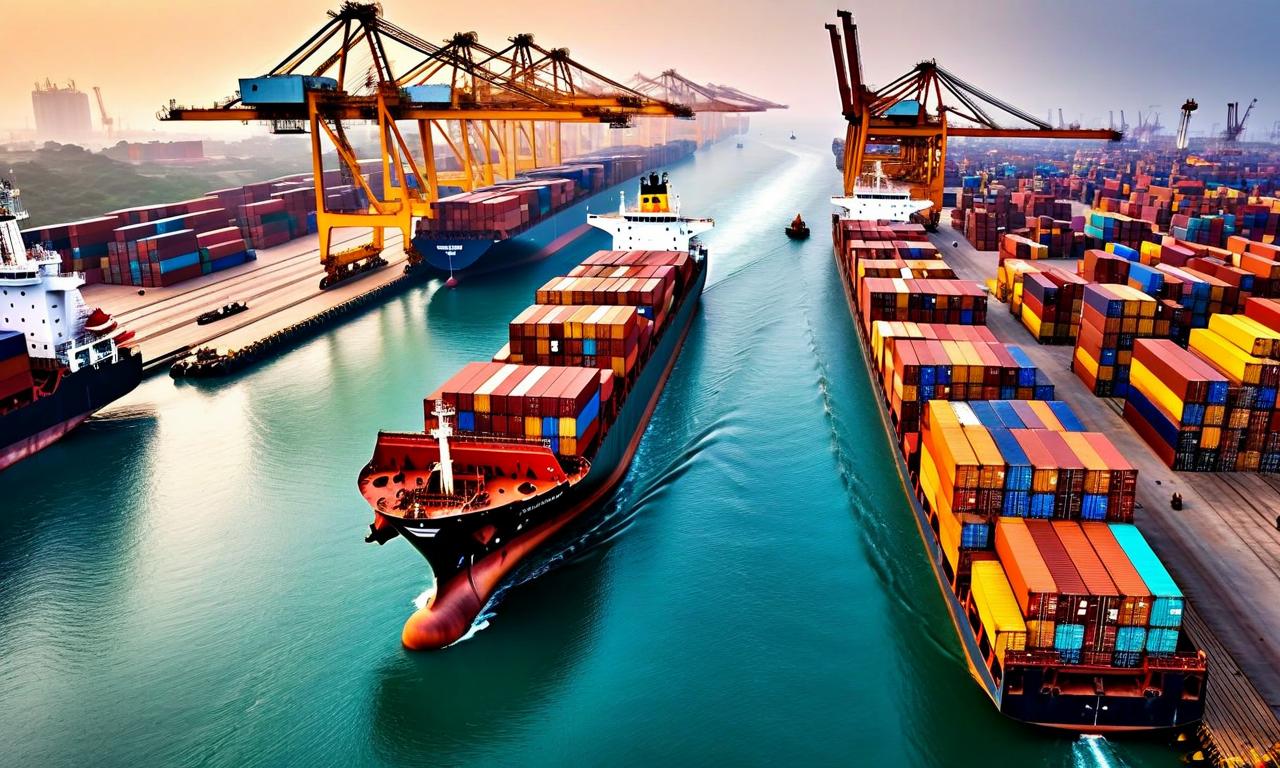
Tanker and Shipping Earnings
The investor presentation for Q4 FY26 highlights average Time Charter Yields (TCYs) across vessel categories, reflecting strong year-on-year earnings growth. Crude Carriers posted the sharpest improvement, with average TCYs rising 98% year-on-year in Q4 FY26. The following table presents the average TCYs across key vessel categories:
| Vessel Category: |
Q4 FY26 (USD/day) |
Q3 FY26 (USD/day) |
QoQ % |
Q4 FY25 (USD/day) |
YoY % |
| Crude Carriers: |
61,424 |
47,281 |
30% |
31,002 |
98% |
| Product Carriers: |
30,511 |
25,117 |
21% |
24,737 |
23% |
| LPG Carriers: |
45,216 |
43,611 |
4% |
43,390 |
4% |
| Dry Bulk: |
16,678 |
17,983 |
-7% |
12,317 |
35% |
For the full year, the Suezmax segment averaged USD 74,377/day in FY26 versus USD 38,780/day in FY25, a 92% increase. The MR (Medium Range) tanker segment averaged USD 28,014/day in FY26 against USD 25,582/day in FY25, a 10% rise. In the dry bulk space, Capesize vessels averaged USD 23,891/day in FY26 versus USD 19,582/day in FY25 (22% increase), while Supramax vessels averaged USD 13,277/day against USD 12,378/day (7% increase). The VLGC (Very Large Gas Carrier) segment averaged USD 53,806/day in FY26 compared to USD 33,345/day in FY25, a 61% improvement.
On the shipping revenue days front, the company recorded total revenue days of 3,525 in Q4 FY26 (owned tonnage: 3,345; inchartered tonnage: 180), compared to 3,546 in Q4 FY25. Total owned tonnage stood at 3.20 million DWT in Q4 FY26 versus 3.04 million DWT in Q4 FY25. On the offshore side, total revenue days were 1,910 in Q4 FY26, comprising 1,627 days from Offshore Logistics and 283 days from Drilling Services, against 1,705 days in Q4 FY25.
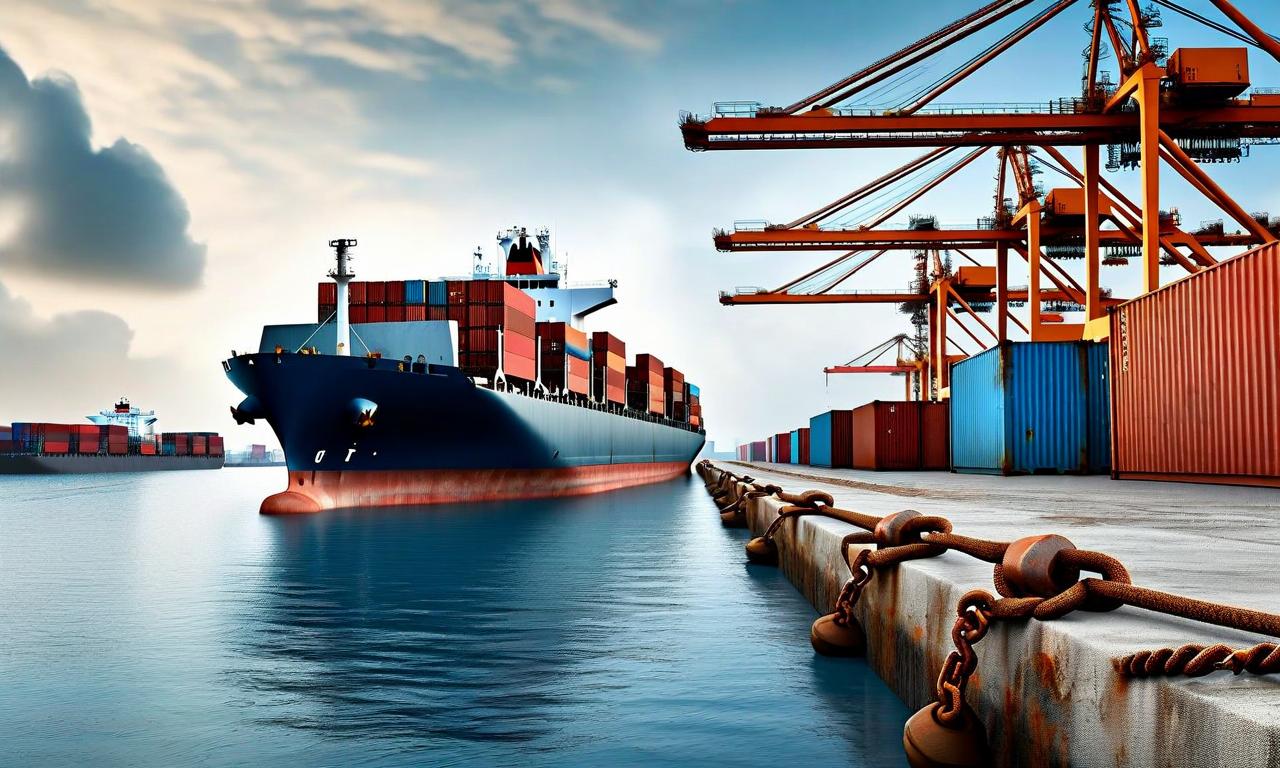
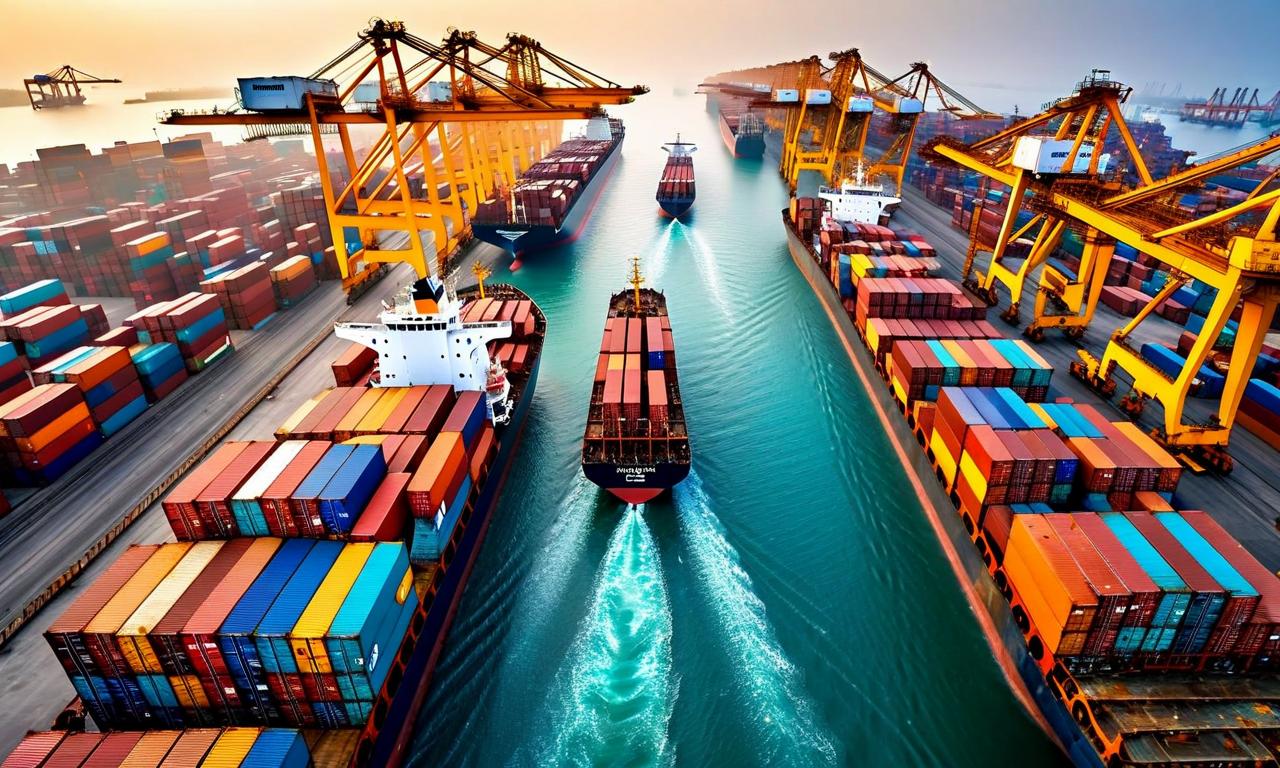
Fleet Profile and Sale & Purchase Activities
As of May 14, 2026, the company's shipping fleet comprised 39 vessels with a total deadweight tonnage (DWT) of 31,91,378 and an average age of 14.32 years. The fleet composition is detailed below:
| Fleet Category: |
No. of Vessels |
DWT |
Avg. Age (Yrs) |
| Crude Carrier: |
5 |
6,91,049 |
15.25 |
| Product Carrier: |
15 |
9,56,648 |
15.39 |
| Gas Carrier: |
4 |
1,89,931 |
17.27 |
| Dry Bulk Carrier: |
15 |
13,53,750 |
11.62 |
| Total: |
39 |
31,91,378 |
14.32 |
During Q4 FY26, the company added three vessels to its fleet — Jag Vijay (Very Large Gas Carrier, 54,564 DWT, built 2015), Jag Riddhi (Ultramax Dry Bulk Carrier, 63,480 DWT, built 2019), and Jag Pranesh (Medium Range Tanker, 51,565 DWT, built 2013). In the quarter-to-date period of Q1 FY27, the company also took delivery of Jag Abhishek (Kamsarmax Dry Bulk Carrier, 63,480 DWT, built 2019). On the divestment side, Jag Aarati (Kamsarmax Dry Bulk Carrier, 80,324 DWT, built 2011) and Jag Vishnu (Very Large Gas Carrier, 49,996 DWT, built 2002) were removed from the fleet in Q4 FY26, while Jag Prakash (Medium Range Tanker, 47,848 DWT, built 2007) and Jag Pankhi (Medium Range Tanker, 46,273 DWT, built 2003) were removed in Q1 FY27 quarter-to-date. The company has additionally contracted to buy one secondhand MR Tanker expected to be executed in Q1 FY27. The offshore fleet as of May 14, 2026 comprised 4 Jack Up Rigs (average age 14.58 years), 4 Platform Supply Vessels (average age 16.75 years), 9 Anchor Handling Tug cum Supply Vessels (average age 16.82 years), 2 Multipurpose Platform Supply & Support Vessels (average age 16.04 years), and 4 ROV Support Vessels (average age 14.59 years).
Revenue Coverage for Q1 FY27
The company has disclosed its operating day coverage for Q1 FY27 across both shipping and offshore segments. The tables below present the coverage levels:
| Shipping Category: |
Q1 FY27 Coverage |
| Crude Carriers: |
52% |
| Product Carriers: |
66% |
| LPG Carriers: |
100% |
| Dry Bulk: |
76% |
| Offshore Category: |
Q1 FY27 Coverage |
| Jack Up Rigs: |
79% |
| AHTSV: |
89% |
| MPSVV: |
84% |
| PSV/ROVSV: |
97% |
Dividend Declaration
The Board declared a fourth interim dividend of Rs. 11.70 per equity share of Rs. 10 each for the financial year 2025-26. For the nine months ended December 31, 2025, the company had declared and paid three interim dividends totalling Rs. 23.40 per equity share. The total dividend declared for the year aggregates to Rs. 35.10 per equity share. The record date for ascertaining eligible shareholders has been fixed as May 20, 2026, and the dividend will be paid on or after June 09, 2026. The Board has decided that there will be no final dividend for the financial year ended March 31, 2026.
Key Financial Ratios
The table below presents select key financial ratios for the consolidated entity for the year ended March 31, 2026:
| Ratio: |
FY26 |
FY25 |
| Debt Equity Ratio (in times): |
0.06 |
0.15 |
| Net Debt Equity Ratio (in times): |
(0.44) |
(0.41) |
| Interest Service Coverage Ratio (in times): |
29.71 |
15.11 |
| Current Ratio (in times): |
7.08 |
6.46 |
| Operating Margin (%): |
58.20 |
51.44 |
| Net Profit Margin (%): |
46.61 |
38.08 |
| Outstanding Debt (Rs. in crores): |
1049.37 |
2155.14 |
Debenture and Large Corporate Disclosure
As per the terms of issue of 4500 Secured Redeemable Non-Convertible Debentures of Rs. 10 lakhs each, the company has created and maintained exclusive charge on ships (over 1.20 times cover on market value of ships) and additional security by way of mortgage on immovable property. As per the terms of issue of 6000 Unsecured Redeemable Non-Convertible Debentures of Rs. 10 lakhs each, the company has maintained unencumbered assets (including cash and cash equivalents) of market value not less than the outstanding face value amount of these debentures. The company has complied with all financial and other covenants as per the debenture trust deeds.
The table below presents the ISIN-wise details of Secured Non-Convertible Debentures as at March 31, 2026:
| ISIN: |
Outstanding (Rs. in crores) |
Interest Accrued (Rs. in crores) |
Book Value of Assets Mortgaged (Rs. in crores) |
Market Value of Assets Mortgaged (Rs. in crores) |
| INE017A07559: |
300.00 |
25.44 |
195.98 |
720.78 |
| INE017A07567: |
150.00 |
4.95 |
166.22 |
550.08 |
| Total: |
450.00 |
30.39 |
362.20 |
1,270.86 |
As per the Large Corporate Disclosure, the company's outstanding qualified borrowings stood at Rs. 1500 crores at the start of the financial year and Rs. 1050 crores at the end of the financial year 2025-26. The highest credit rating of the company is AAA. No incremental borrowing was done during the year by way of issuance of debt securities.
CSR Initiatives
Great Eastern Shipping has also disclosed its corporate social responsibility activities. The company has cumulatively spent INR 185 crore on CSR initiatives, partnering with 61 NGOs across 22 states and union territories. The CSR programme spans education, health, and livelihood sectors, supporting a broad range of organisations across India.


 16
16