

Glen Industries H1FY27 Results: Revenue grows 18.84% YoY to ₹113.57 crore


- Revenue grew 18.84% YoY to ₹113.57 crore in H1 FY27
- Export share of revenue accounted for 26% during the period
- New manufacturing facility in Howrah will add thermoforming and paper cup capabilities
- Company serves 40+ recurring international customers across 30+ countries

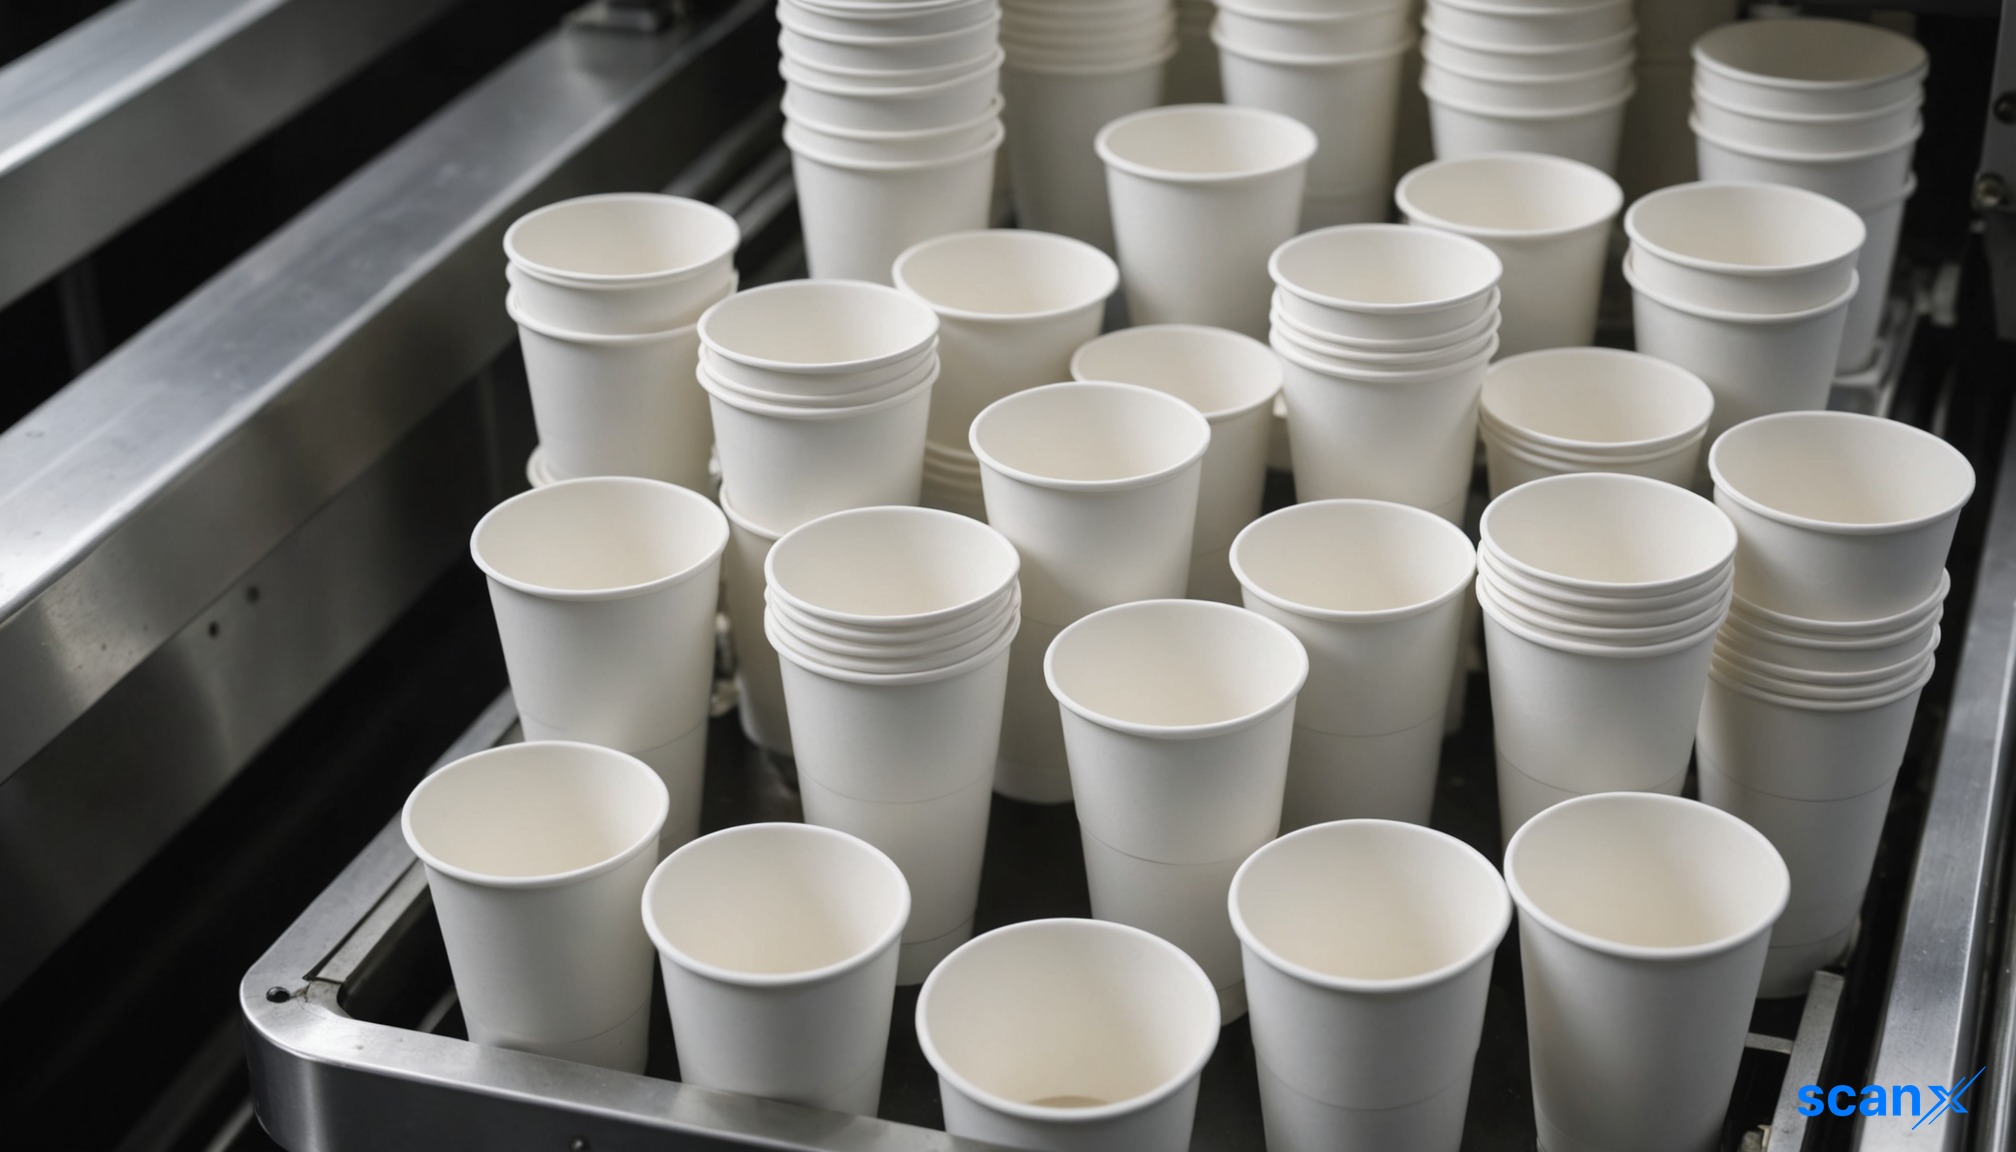

*this image is generated using AI for illustrative purposes only.
Glen Industries reported revenue of ₹113.57 crore for the first half of FY27, marking an 18.84% year-on-year increase. The manufacturer of eco-conscious food packaging continues to expand its global footprint and product range.
The company serves over 40 recurring international customers across 30+ countries, including markets in the US, Canada, EU, UK, Australia, Middle East, and Africa. Domestically, Glen Industries operates across 26 states and 80+ cities in India.
Capacity and operational metrics
As of September 30, 2026, the company’s manufacturing capabilities include thin wall containers, PLA straws, and paper straws. The table below outlines key operating metrics:
| Metric | Status/Value |
|---|---|
| Thin wall containers capacity | 665 MT/month |
| PLA straws capacity | 160 MT/month |
| Paper straws capacity | 95 MT/month |
| Export share of revenue (H1 FY27) | 26% |
| Capacity utilisation (thin wall containers) | 3,133 MT |
Strategic developments
Glen Industries is progressing on a new manufacturing facility in Howrah, West Bengal. This expansion aims to add thermoforming and paper cup capabilities to its existing portfolio of thin wall food containers and straws. The move supports the company’s strategy to introduce paper and thermoforming-based disposable solutions.
The company maintains certifications including FSSC 22000, ISO 9001:2015, ISO 14001:2015, HACCP, FSC, and SEDEX 4-Pillar. Its paper straws are made from FSC-certified paper and comply with USFDA standards.
What the numbers show
The export share of revenue stood at 26% in H1 FY27, indicating that nearly three-quarters of sales remain domestic. With capacity utilisation for thin wall containers recorded at 3,133 MT against a monthly capacity of 665 MT, the company has significant headroom for volume growth without immediate capital expenditure on new lines for this specific product category.
Historical Stock Returns for Glen Industries
| 1 Day | 5 Days | 1 Month | 6 Months | 1 Year | 5 Years |
|---|---|---|---|---|---|
| -0.92% | -6.88% | -9.49% | +71.21% | +28.41% | -25.84% |

How will the addition of thermoforming and paper cup capabilities at the Howrah facility impact Glen Industries' average selling prices and gross margins compared to its current straw and container products?
What specific regulatory changes in the EU or US are driving the 18.84% YoY revenue growth, and how might potential new plastic bans in other regions affect future export volumes?
Given that thin wall container capacity utilization suggests significant headroom, what is the company's timeline for achieving higher utilization rates before considering further capital expenditure on this product line?
 17
17
















 Access Market Heat-map & Insights
  Create, Save & Share your Screener
  Use 200+ Screening Filters





