

GE Vernova T&D Q1 Results: Revenue up 38% YoY, profit jumps 1.25x


GE Vernova T&D India reported Q1FY27 revenue of ₹1,840 crore, up 38% YoY, driven by strong execution against a ₹20,900 crore order backlog. Profit before tax jumped over 1.25x to ₹490 crore, though gross margins moderated to 41.3% due to lower export mix and commodity costs. The company remains debt-free with ₹2,930 crore in cash, planning ₹1,000 crore for capex and ₹250 crore for dividends.


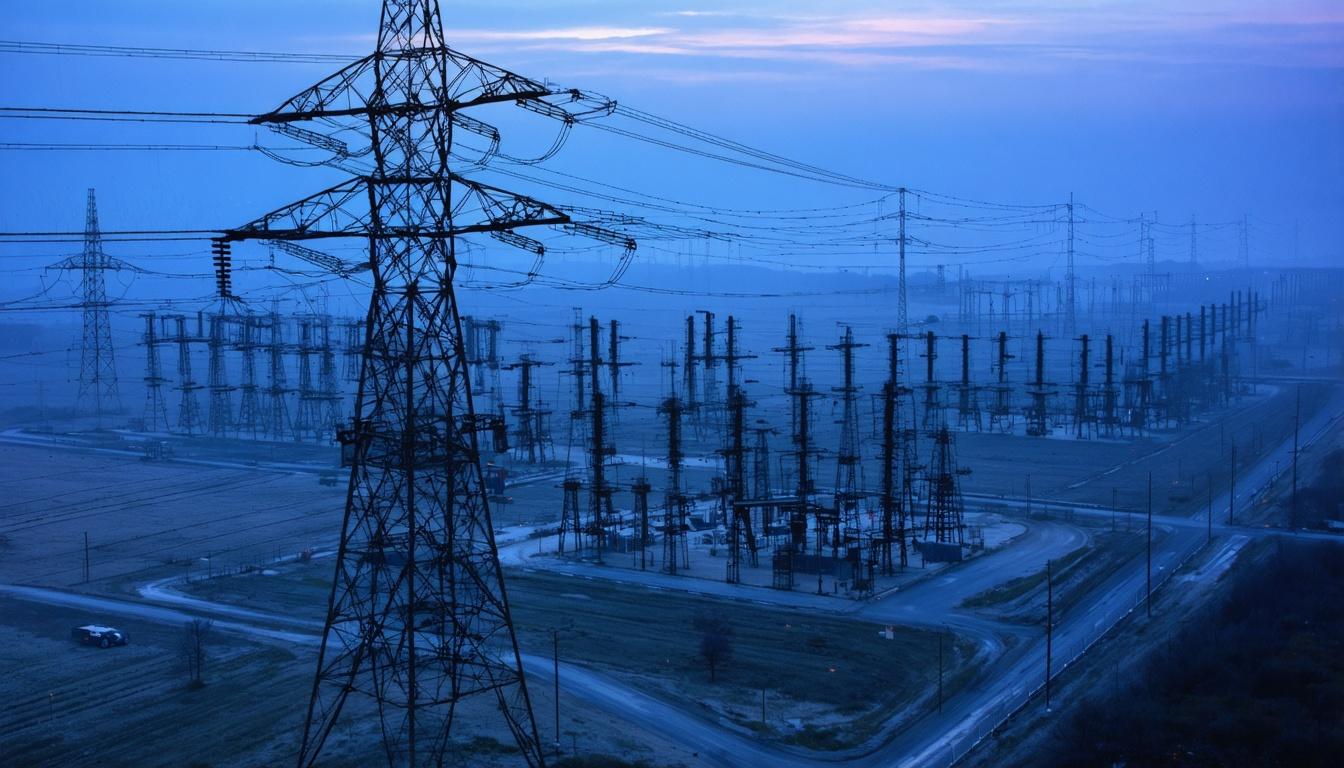
*this image is generated using AI for illustrative purposes only.
GE Vernova T&D India Limited delivered robust top-line growth in the first quarter of FY27, with revenue rising 38% year-on-year to ₹1,840 crore from ₹1,330 crore in the corresponding period of FY26. The company’s execution pace outstripped new order intake, driving a significant expansion in profitability even as gross margins faced headwinds from mix shifts and commodity costs.
Financial Performance
Profit before tax and exceptional items for the quarter ended June 2026 reached ₹490 crore, compared to approximately ₹390 crore in the same quarter of the previous financial year, marking a growth of more than 1.25x. This operational leverage was achieved despite a moderation in gross margins, which fell to 41.3% from 48.4% a year ago and 47% in the preceding quarter.
| Metric | Q1FY27 | Q1FY26 | Change |
|---|---|---|---|
| Revenue | ₹1,840 crore | ₹1,330 crore | +38% YoY |
| Profit Before Tax (excl. exceptional) | ₹490 crore | ₹390 crore | >1.25x YoY |
| Gross Margin | 41.3% | 48.4% | -710 bps |
| EBITDA Margin | 25.1% | ~27.1%* | In line with guidance |
*Note: FY26 full-year gross margin was 45.3%; EBITDA margin comparison based on management commentary regarding mid-20s guidance.
The company maintained its EBITDA margin at 25.1%, consistent with its mid-20s band guidance. Management attributed the gross margin compression to three primary factors: a lower share of high-margin export revenues (30% of total revenue in Q1FY27 versus 33% in FY26), elevated commodity prices reducing execution savings, and the ramp-up of higher-voltage business segments which carry lower gross margins but offer better operating leverage at the EBITDA level.
Order Book and Backlog
New order intake moderated to ₹1,140 crore in Q1FY27, down 30% year-on-year from ₹1,620 crore in Q1FY26. This decline was primarily due to lower realization of transformers, circuit breakers, and busbar (TBCB) market opportunities in the fourth quarter of FY26. Consequently, the order backlog decreased by 2.5% quarter-on-quarter to ₹20,900 crore as of June 2026, from ₹21,460 crore at the end of March 2026.
Despite the sequential dip, the backlog represents more than three years of FY26 revenue, providing multi-year visibility. Private customers now account for 77% of the backlog, central utilities and PSUs contribute 21%, and state utilities exposure has reduced to just 2%, reflecting a continued de-risking of counterparty concentration.
What the Numbers Show
A critical divergence exists between the company’s top-line momentum and new order inflows. While revenue surged 38% driven by the conversion of existing backlog, new orders contracted significantly. However, this divergence is mitigated by the sheer scale of the remaining order book (₹20,900 crore), which acts as a buffer against short-term demand volatility. Furthermore, the shift in customer mix towards private entities (77% of backlog) suggests improved credit quality and potentially faster realization cycles compared to state-owned utilities, enhancing the predictability of future cash flows.
Balance Sheet and Capital Allocation
GE Vernova T&D India remains debt-free, maintaining a zero-net-debt position. The company generated ₹430 crore in cash during the quarter, bringing total available cash—including funds lent to the cash pool—to ₹2,930 crore.
Management outlined a utilization plan for approximately ₹1,300 crore of this surplus, comprising:
- ₹1,000 crore for capacity expansion programs announced in the previous financial year.
- ₹250 crore for dividend payout in Q2FY27, subject to shareholder approval.
The remaining cash balance is under evaluation for further shareholder return optimization. Export diversification continues to strengthen, with exports constituting 46% of Q1 orders, including secured deals from GE Vernova entities in North America, Spain, and Morocco.
Operational Highlights
The company commissioned its first 400 kV substation in Nepal for the NEA Khimti site, marking a key milestone in regional grid infrastructure. Domestically, it partnered with Adani to build substations for renewable power evacuation from the Khavda solar park and augmented transformation capacity for key clients including PGCIL, Resonia, and NLP. Management noted that while the domestic TBCB pipeline was soft in the first half of the year, visibility has improved since June, with expectations for better order conversion in subsequent quarters.
Historical Stock Returns for GE Vernova T&D
| 1 Day | 5 Days | 1 Month | 6 Months | 1 Year | 5 Years |
|---|---|---|---|---|---|
| +0.26% | -5.74% | -6.78% | -4.24% | +35.23% | 0.0% |

How will the shift towards higher-voltage business segments impact long-term gross margin recovery given their lower initial margins but better operating leverage?
What specific strategies is GE Vernova T&D India employing to accelerate new order intake in the domestic TBCB market following the recent softness?
Will the planned ₹1,000 crore capacity expansion be sufficient to meet the demand from the ₹20,900 crore backlog, or will further capital expenditure be required in FY28?
 19
19









 Create Custom Screeners
  Access 200+ Pre-built Filters
  Use 50+ Readymade Screener





