

Avenue Supermarts FY26 Audited Results: 15.9% Revenue Growth, 500 Stores Milestone


Avenue Supermarts reported strong FY26 audited results with standalone total income growing 15.8% to ₹67,096.05 crore and net profit after tax rising 10.1% to ₹3,223.93 crore. Q4FY26 standalone total income grew 18.9% YoY to ₹17,235.20 crore, while the company achieved a landmark 500 DMart stores milestone with 85 new store additions during FY26. Brokerages issued mixed ratings post-results, with CLSA at High Conviction Outperform (₹6,628 target) and Goldman Sachs and Citi maintaining Sell ratings.

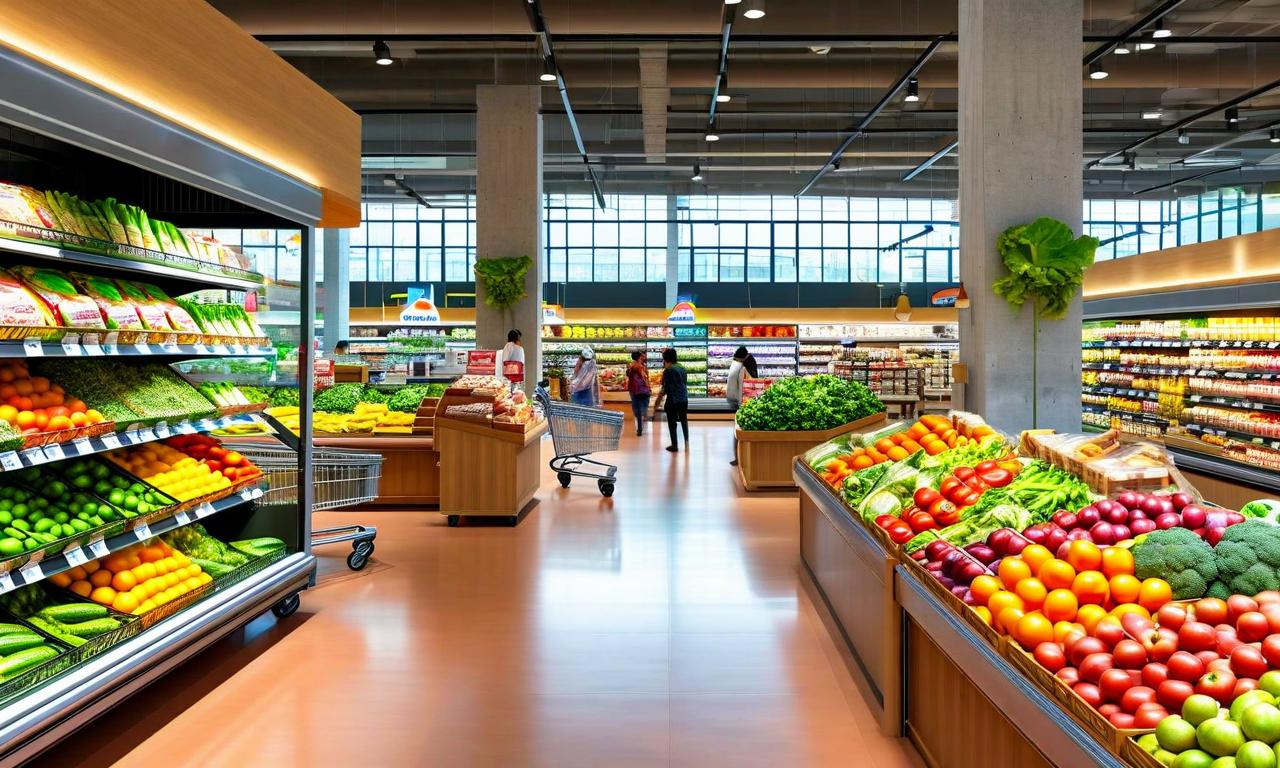

*this image is generated using AI for illustrative purposes only.
Avenue Supermarts Limited announced its standalone and consolidated audited financial results for the quarter and year ended 31st March, 2026. The company delivered robust performance with significant growth across key metrics, while achieving a major milestone in store expansion. The Board of Directors approved the financial results at its meeting held on 2nd May, 2026, and the newspaper publication was completed on 4th May, 2026, in Economic Times and Maharashtra Times, in accordance with Regulation 47 of the SEBI (Listing Obligation and Disclosure Requirements) Regulations, 2015.
Q4FY26 Standalone Performance
For the quarter ended March 31, 2026, standalone total income stood at ₹17,235.20 crore, representing year-on-year growth of 18.9% compared to ₹14,501.52 crore in Q4FY25. Net profit before tax increased to ₹968.11 crore from ₹788.52 crore in the corresponding quarter of the previous year. Net profit after tax for Q4FY26 stood at ₹724.60 crore, up 16.9% from ₹619.71 crore in Q4FY25. Total Comprehensive Income for Q4FY26 stood at ₹732.66 crore compared to ₹623.31 crore in Q4FY25. Basic earnings per share (EPS) for Q4FY26 reached ₹11.13 compared to ₹9.52 for Q4FY25, while diluted EPS stood at ₹11.13 versus ₹9.50 in Q4FY25.
FY26 Standalone Performance
For the full year FY26, standalone total income reached ₹67,096.05 crore, growing 15.8% from ₹57,963.83 crore in FY25. Net profit before tax stood at ₹4,318.50 crore, up 11.2% from ₹3,883.17 crore in FY25. Net profit after tax for FY26 stood at ₹3,223.93 crore, up 10.1% from ₹2,927.18 crore in FY25. Total Comprehensive Income for FY26 was ₹3,219.16 crore compared to ₹2,919.85 crore in FY25. Basic EPS for FY26 improved to ₹49.54 from ₹44.98 in FY25, while diluted EPS stood at ₹49.52 versus ₹44.87 in FY25. The paid-up equity share capital (face value ₹10 each) stood at ₹651.96 crore, with other equity excluding revaluation reserves at ₹24,867.63 crore.
The following table presents the key standalone and consolidated financial metrics:
| Financial Metric: | Q4FY26 | Q4FY25 | FY26 | FY25 |
|---|---|---|---|---|
| Total Income: | ₹17,235.20 crore | ₹14,501.52 crore | ₹67,096.05 crore | ₹57,963.83 crore |
| Net Profit Before Tax: | ₹968.11 crore | ₹788.52 crore | ₹4,318.50 crore | ₹3,883.17 crore |
| Net Profit After Tax: | ₹724.60 crore | ₹619.71 crore | ₹3,223.93 crore | ₹2,927.18 crore |
| Total Comprehensive Income: | ₹732.66 crore | ₹623.31 crore | ₹3,219.16 crore | ₹2,919.85 crore |
| Basic EPS (₹): | ₹11.13 | ₹9.52 | ₹49.54 | ₹44.98 |
| Diluted EPS (₹): | ₹11.13 | ₹9.50 | ₹49.52 | ₹44.87 |
Consolidated Performance
On a consolidated basis, total income for Q4FY26 stood at ₹17,702.03 crore, up from ₹14,896.91 crore in Q4FY25. Net profit before tax increased to ₹904.17 crore from ₹720.30 crore. Net profit after tax stood at ₹656.42 crore compared to ₹550.79 crore in the corresponding quarter. Total Comprehensive Income for Q4FY26 was ₹664.75 crore versus ₹554.89 crore in Q4FY25. Basic EPS for Q4FY26 was ₹10.09 compared to ₹8.47 for Q4FY25, while diluted EPS stood at ₹10.09 versus ₹8.45 in Q4FY25.
For FY26, consolidated total income reached ₹68,894.84 crore, up from ₹59,482.36 crore in FY25. Net profit before tax stood at ₹4,081.62 crore compared to ₹3,672.67 crore in FY25. Net profit after tax for FY26 was ₹2,969.86 crore, up from ₹2,707.45 crore in the previous year. Total Comprehensive Income for FY26 stood at ₹2,964.38 crore compared to ₹2,698.64 crore in FY25. Basic EPS for FY26 stood at ₹45.65 compared to ₹41.61 in FY25, while diluted EPS was ₹45.63 versus ₹41.50 in FY25. The paid-up equity share capital stood at ₹651.96 crore, with other equity excluding revaluation reserves at ₹23,812.08 crore.
| Financial Metric: | Q4FY26 | Q4FY25 | FY26 | FY25 |
|---|---|---|---|---|
| Total Income: | ₹17,702.03 crore | ₹14,896.91 crore | ₹68,894.84 crore | ₹59,482.36 crore |
| Net Profit Before Tax: | ₹904.17 crore | ₹720.30 crore | ₹4,081.62 crore | ₹3,672.67 crore |
| Net Profit After Tax: | ₹656.42 crore | ₹550.79 crore | ₹2,969.86 crore | ₹2,707.45 crore |
| Total Comprehensive Income: | ₹664.75 crore | ₹554.89 crore | ₹2,964.38 crore | ₹2,698.64 crore |
| Basic EPS (₹): | ₹10.09 | ₹8.47 | ₹45.65 | ₹41.61 |
| Diluted EPS (₹): | ₹10.09 | ₹8.45 | ₹45.63 | ₹41.50 |
Store Expansion and Business Updates
The company opened 58 new stores during Q4FY26, reaching a landmark achievement of 500 DMart stores. For the full year FY26, 85 stores were added. As of March 31, 2026, the company had 500 stores with a retail business area of 20.6 million sq. ft. across multiple states including Maharashtra, Gujarat, Telangana, Andhra Pradesh, Karnataka, Tamil Nadu, Madhya Pradesh, Rajasthan, Punjab, NCR, Chhattisgarh, Uttar Pradesh, Daman, Goa, Odisha, Uttarakhand and Haryana.
Two years and older DMart stores grew by 10.8% during Q4FY26 compared to 8.1% in Q4FY25. The company's E-Commerce (DMart Ready) business operates in 18 cities as of March 31, 2026, with focus on key metro towns and renewed emphasis on home delivery as the preferred channel.
Brokerage Views Post Q4FY26 Results
Leading brokerages have issued divergent ratings on Avenue Supermarts following the Q4FY26 results, with views ranging from high conviction outperform to sell. The table below summarises the key ratings and target prices:
| Brokerage: | Rating | Target Price |
|---|---|---|
| Goldman Sachs: | Sell | ₹4,000 (raised) |
| Morgan Stanley: | Overweight | ₹5,188 |
| Jefferies: | Hold | ₹4,500 (raised) |
| CLSA: | High Conviction Outperform | ₹6,628 |
| Citi: | Sell | ₹3,650 |
Goldman Sachs maintained a Sell rating with a raised target price of ₹4,000, noting that while Q4 growth improved with sales up 19% and like-for-like (LFL) growth of approximately 10.8% with margins in line, demand was partly one-off. The brokerage acknowledged support from price hikes, store expansion, and lower interest costs, but cited limited upside.
Morgan Stanley rated the stock Overweight with a target price of ₹5,188, highlighting the strong Q4 performance with LFL growth of approximately 10.8% beating estimates, modest margin expansion of approximately 40 basis points, stable operations without supply disruptions, and a transient demand spike normalizing to support a steady growth outlook.
Jefferies maintained a Hold rating with a raised target price of ₹4,500, pointing to a Q4 EBITDA beat of approximately 25% year-on-year, strong double-digit LFL growth, and record store additions of 58 along with expansion into new states. However, the brokerage noted the demand spike was temporary and that DMart Ready continues rationalisation.
CLSA assigned a High Conviction Outperform rating with a target price of ₹6,628, citing strong Q4 EBITDA growth of 25% and PAT growth of 17%, with a margin beat driven by operating leverage despite higher employee costs. The brokerage noted that PAT lagged due to lower other income and higher finance costs from expansion-led borrowings.
Citi retained a Sell rating with a target price of ₹3,650, acknowledging that Q4 growth improved with same-store growth (SSG) of approximately 10.8% and revenue and EPS growth of 19% and 17% respectively, but flagged that the improvement was partly one-off. Citi also highlighted weak free cash flow turning negative, rising debt, profit lagging revenue, and competitive pressure from quick commerce as factors limiting upside.
Historical Stock Returns for Avenue Supermarts DMart
| 1 Day | 5 Days | 1 Month | 6 Months | 1 Year | 5 Years |
|---|---|---|---|---|---|
| -1.14% | -6.05% | -11.18% | -25.39% | -23.45% | 0.0% |

With DMart reaching 500 stores and adding 85 in FY26, can the company sustain a similar or accelerated store addition pace in FY27 without further straining free cash flow and debt levels?
Given that multiple brokerages flagged the Q4FY26 demand spike as partly one-off, how will Avenue Supermarts' same-store sales growth trend in the coming quarters as the temporary tailwinds from price hikes normalize?
As quick commerce platforms intensify competition in urban grocery retail, what strategic shifts could DMart Ready need to undergo beyond its current home delivery focus to defend market share in metro cities?
 17
17






 Access Market Heat-map & Insights
  Create, Save & Share your Screener
  Use 200+ Screening Filters





