

DEE Development Engineers files FY26 sustainability report with key ESG metrics


- Total energy consumption fell to 61,255.72 GJ from 68,490 GJ in FY25
- Combined Scope 1 and 2 GHG emissions intensity dropped to 0.91 tCO₂e per million INR
- Water withdrawal surged to 2,28,063.54 KL, up from 21,830 KL previously
- Total waste generated increased to 1,177.77 MT from 1.33 MT in the prior year
- Board gender diversity stands at 50%, with three female directors



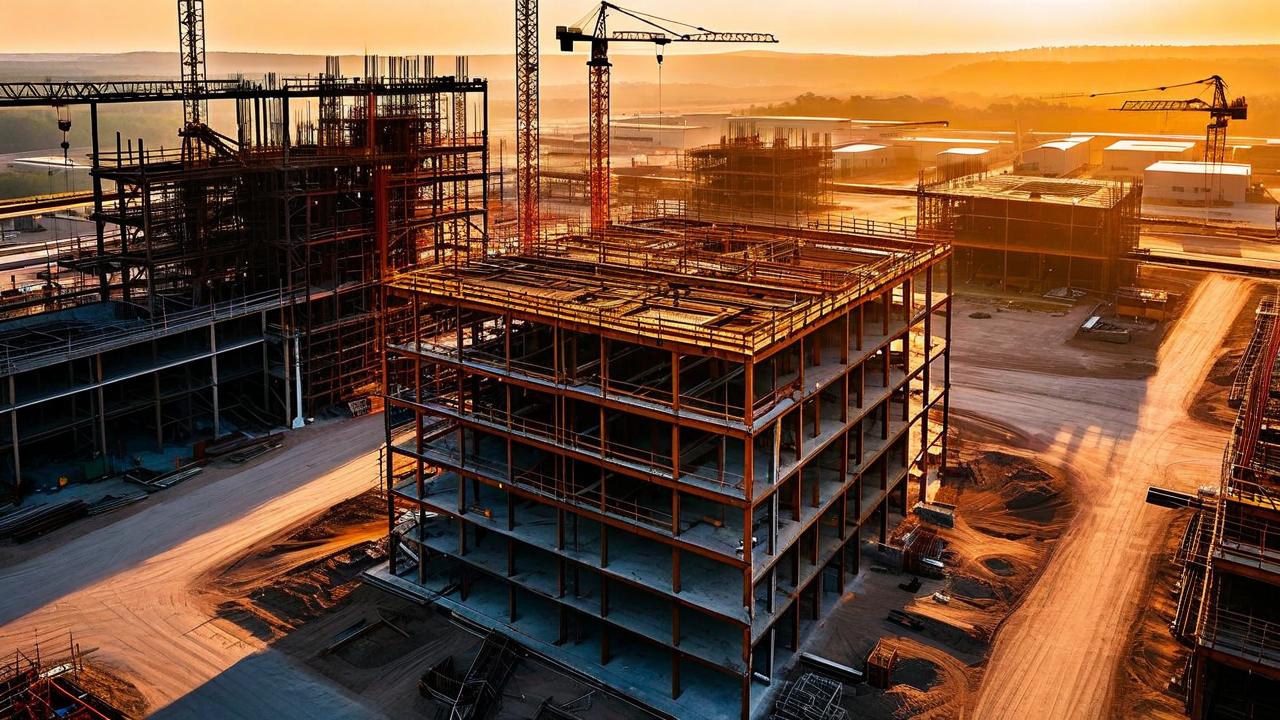
*this image is generated using AI for illustrative purposes only.
DEE Development Engineers submitted its Business Responsibility and Sustainability Report (BRSR) for the financial year ended March 31, 2026, on August 27, 2026. The filing covers consolidated operations across its manufacturing and biomass power generation segments.
The company reported total energy consumption of 61,255.72 GJ, a decline from 68,490 GJ in the prior year. This reduction drove a decrease in energy intensity per rupee of turnover from 8.07 GJ per million INR to 6.61 GJ per million INR. Renewable sources contributed 3,404.08 GJ of the total mix.
Environmental Performance
Greenhouse gas emissions showed a downward trajectory in FY26. Total Scope 1 emissions fell to 1,277.21 tCO₂e from 2,391.24 tCO₂e in FY25. Scope 2 emissions decreased to 7,121.76 tCO₂e from 8,189.43 tCO₂e. Consequently, the combined emission intensity dropped to 0.91 tCO₂e per million INR of turnover, compared to 1.24 tCO₂e per million INR previously.
Water withdrawal increased significantly to 2,28,063.54 kilolitres (KL) from 21,830 KL in FY25, driven by surface water withdrawals of 1,93,588.11 KL. Total water consumption stood at 1,89,527.54 KL, resulting in a water intensity of 20.63 KL per million INR of turnover.
Waste Management
Total waste generated rose sharply to 1,177.77 metric tonnes (MT) in FY26, up from just 1.33 MT in FY25. Non-hazardous waste accounted for 966.57 MT, while other hazardous waste comprised 161.09 MT. The company disposed of 34.59 MT of plastic waste and 31.69 MT of other non-hazardous waste through other disposal operations.
Governance and Social Metrics
The company employs 1,144 permanent employees and 2,306 workers. Female representation among permanent employees stands at 4.15%, while women constitute only 0.82% of the worker base. The board includes three female directors, representing 50% of the total six-member board.
No complaints were recorded regarding sexual harassment, discrimination, or child labour during the reporting period. The company reported zero lost-time injury frequency rates for both employees and workers.
What the Numbers Show
The divergence between rising water withdrawal and falling energy consumption highlights a shift in resource intensity. While energy efficiency measures reduced carbon footprint and energy costs, operational scaling or process changes likely drove the tenfold increase in water usage, raising water intensity metrics significantly despite stable revenue levels implied by the turnover-based calculations.
Historical Stock Returns for DEE Development Engineers
| 1 Day | 5 Days | 1 Month | 6 Months | 1 Year | 5 Years |
|---|---|---|---|---|---|
| -0.72% | -6.25% | -6.07% | +49.01% | +110.65% | +70.15% |

How does DEE Development Engineers plan to mitigate the tenfold increase in water withdrawal to align with long-term sustainability goals?
What specific operational changes or expansions contributed to the sharp rise in waste generation from 1.33 MT to 1,177.77 MT?
Will the company introduce new initiatives to improve the low female representation among its permanent employees and worker base?
 20
20









 Create Custom Screeners
  Access 200+ Pre-built Filters
  Use 50+ Readymade Screener





