

BlueStone Jewellery releases FY26 annual report, confirms ₹26 crore net profit


BlueStone Jewellery & Lifestyle Limited reported a net profit of ₹26 crore for FY26, up from a loss of ₹2,192 crore in FY25, driven by 37.9% revenue growth to ₹2,441 crore. The company expanded to 340 stores and reduced net debt to ₹3,469 million. Its 15th AGM is scheduled for September 14, 2026.


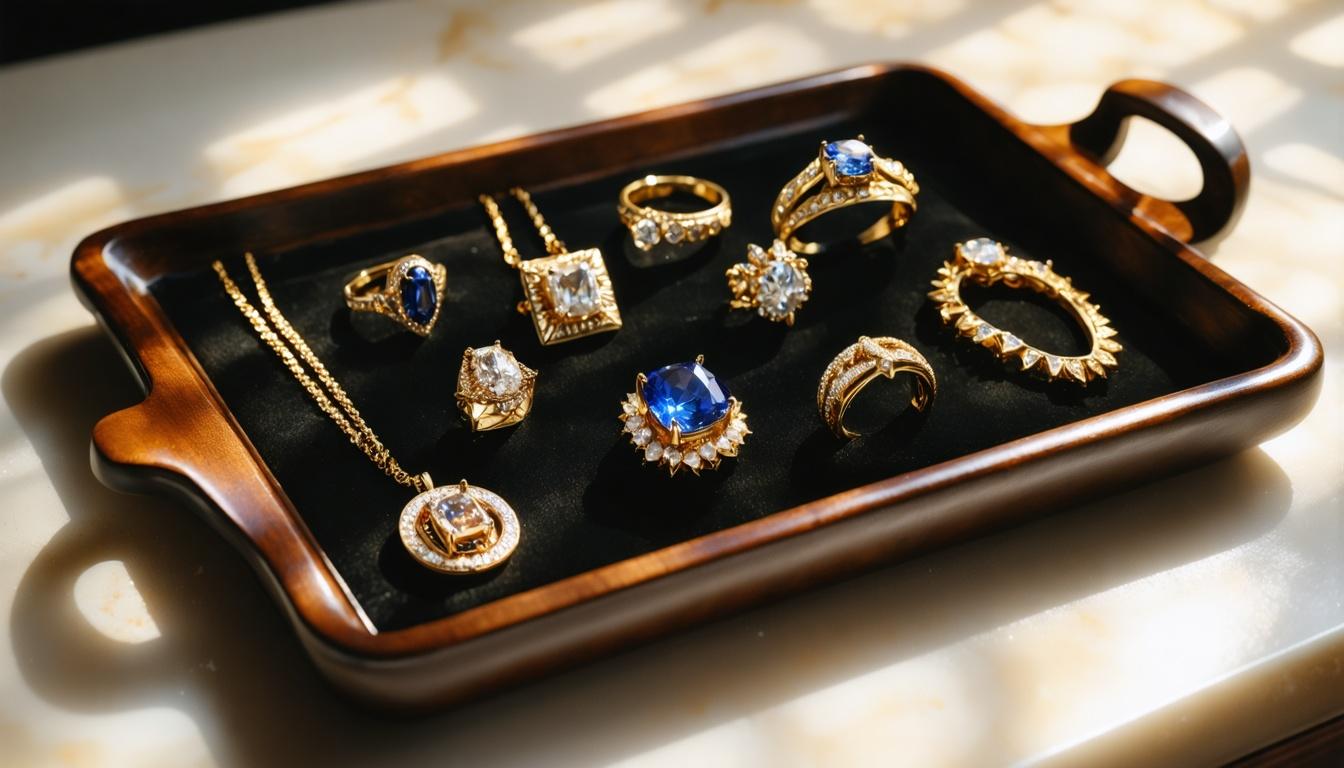
*this image is generated using AI for illustrative purposes only.
BlueStone Jewellery & Lifestyle Limited has released its Annual Report for the financial year ended March 31, 2026 (FY26), marking the company’s first full fiscal year of profitability since going public. The report confirms a net profit after tax (PAT) of ₹26 crore, a significant turnaround from the loss of ₹2,192 crore recorded in FY25.
The company’s revenue from operations grew 37.9% year-on-year to ₹2,441 crore. This growth was underpinned by the expansion of its retail footprint to 340 stores across 134 cities, including the addition of 65 new outlets during the year. Operating leverage was evident as EBITDA surged 419.8% to ₹395 crore, with the EBITDA margin expanding by 1,187 basis points to 16.2% from 4.3% in FY25.
Financial Performance
The shift to profitability was supported by disciplined cost management and operational efficiencies. Advertising and marketing costs were contained at 6.6% of sales in FY26, down from 9.0% in FY25. The company recognized a non-cash employee stock option (ESOP) expense of ₹927 million, which management noted is front-loaded under the current grant cycle and expected to decline materially in subsequent years.
| Metric | FY26 | FY25 | Change |
|---|---|---|---|
| Revenue: | ₹2,441 crore | ₹1,770 crore | +37.9% |
| EBITDA: | ₹395 crore | ₹76 crore | +419.8% |
| EBITDA Margin: | 16.2% | 4.3% | +1,187 bps |
| PAT / (Loss): | ₹26 crore | (₹2,192 crore) | NM |
Operational Expansion and Balance Sheet
BlueStone’s physical presence expanded significantly, with 75% of its store cohorts breaking even within three months of opening. The company leveraged its digital-first data to identify high-demand locations before committing capital. More than half of the revenue now comes from repeat customers, signaling strong brand loyalty.
The balance sheet strengthened following the initial public offering (IPO) and improved internal accruals. Net debt reduced to ₹3,469 million as of March 31, 2026, from ₹6,171 million a year earlier. Return on Capital Employed (ROCE) turned positive at 8.6%, compared to negative 4.7% in FY25.
Corporate Governance and AGM
The 15th Annual General Meeting (AGM) of the company will be held on Monday, September 14, 2026, at 4:30 pm through Video Conferencing or Other Audio Visual Means. The remote e-voting facility will be open from Friday, September 11, 2026, at 9:00 am to Sunday, September 13, 2026, at 5:00 pm.
The Board of Directors approved the appointment of Mr. Amit Jain as a Non-Executive, Non-Independent Director in place of Mr. Sameer Dileep Nath, who retires by rotation and does not seek re-election. Mr. Jain is the CEO and Co-Founder of CarDekho Group.
What the Numbers Show
The divergence between the sharp rise in PAT and the substantial non-cash ESOP expense highlights the underlying operational strength of the business. While reported PAT was ₹26 crore, the addition back of the ₹927 million ESOP charge suggests that cash profitability and operational cash flow generation are significantly higher than the bottom line indicates. This front-loaded expense structure implies that future reported earnings could see material uplifts as these charges decline, assuming revenue growth continues at current trajectories.
Historical Stock Returns for BlueStone Jewellery & Lifestyle
| 1 Day | 5 Days | 1 Month | 6 Months | 1 Year | 5 Years |
|---|---|---|---|---|---|
| +1.80% | -3.62% | -11.90% | +57.45% | +12.74% | +43.66% |

How will the expected decline in front-loaded ESOP expenses impact BlueStone's reported PAT and valuation multiples in FY27?
Can BlueStone sustain its 16.2% EBITDA margin as it continues to expand its retail footprint to 340 stores and beyond?
What is the company's strategy for maintaining high repeat customer rates amidst increasing competition in the online jewelry sector?
 17
17










 Access 50+ Readymade Screeners
  Use 200+ Custom Filters
  Get Full Market Insights





