

Bharat Coking Coal raw coal output dips 0.2% in August 2026


- Total raw coal production dipped 0.2% YoY to 2.21 million tonnes in August 2026
- Coking coal output grew 2.8% to 2.18 million tonnes, driving core segment growth
- Non-coking coal production fell sharply by 65.9% to 0.03 million tonnes
- Opencast mines contributed 2.19 million tonnes, up 1.4% year-on-year
- Five-month progressive raw coal production declined 17.7% to 11.21 million tonnes

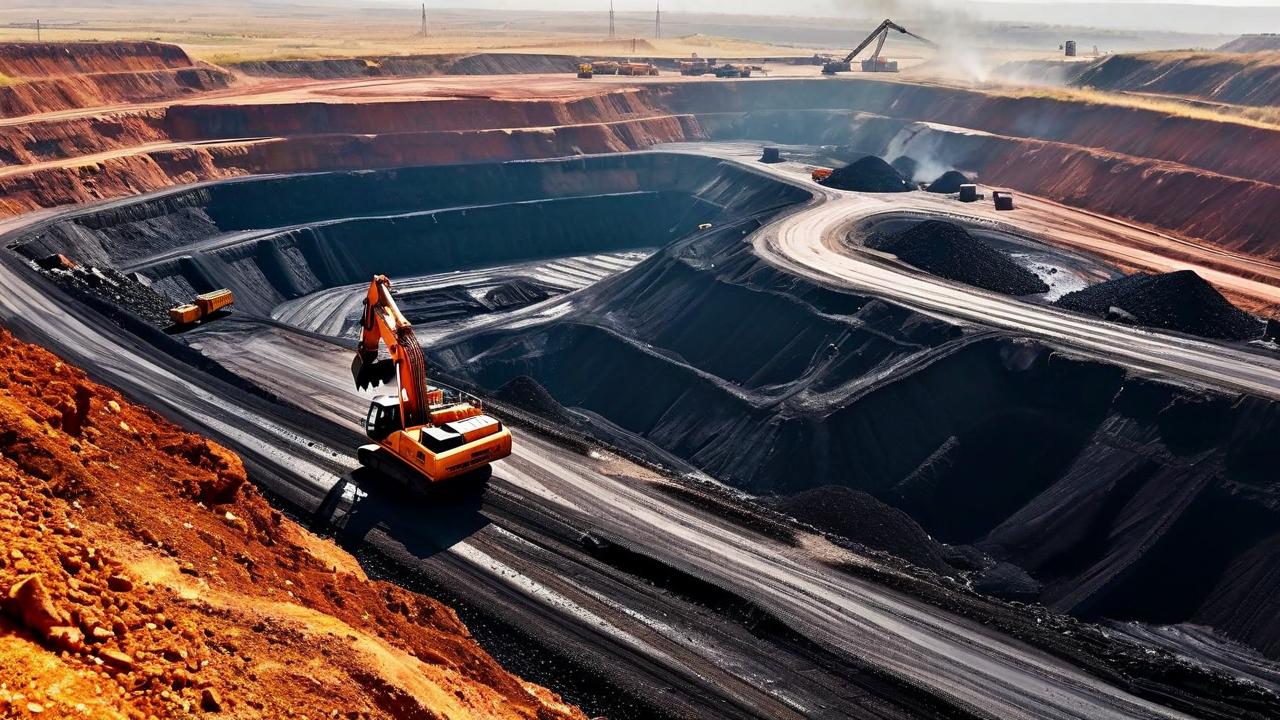

*this image is generated using AI for illustrative purposes only.
Bharat Coking Coal reported total raw coal production of 2.21 million tonnes in August 2026, marking a marginal 0.2% decline year-on-year.
The company disclosed its provisional monthly production performance under Regulation 30 of the SEBI (Listing Obligations and Disclosure Requirements) Regulations, 2015. While coking coal output grew, the overall figure was weighed down by a sharp contraction in non-coking coal and underground mine operations.
Production performance in August 2026
Total raw coal production stood at 2.21 million tonnes, compared to 2.21 million tonnes in August 2025. The slight dip reflects divergent trends across coal types and mining methods.
| Metric | August 2026 | August 2025 | Change |
|---|---|---|---|
| Total raw coal (MT) | 2.21 | 2.21 | -0.2% |
| Coking coal (MT) | 2.18 | 2.12 | +2.8% |
| Non-coking coal (MT) | 0.03 | 0.09 | -65.9% |
| Washed coking coal (MT) | 0.11 | 0.10 | +13.8% |
Segment-wise breakdown
Coking coal remained the dominant contributor, rising 2.8% to 2.18 million tonnes. In contrast, non-coking coal production fell 65.9% to just 0.03 million tonnes. Washed coking coal output increased 13.8% to 0.11 million tonnes.
By mining method, opencast mines produced 2.19 million tonnes (up 1.4%), while underground mines saw a 59.3% drop to 0.02 million tonnes. Offtake of raw coal remained stable at 2.77 million tonnes, up 0.1% YoY.
Progressive performance (Apr-Aug 2026)
For the five-month period ending August 2026, total raw coal production declined 17.7% to 11.21 million tonnes from 13.62 million tonnes in the same period last year. Coking coal production for the period fell 17.3% to 10.75 million tonnes. Overburden removal dropped 25.1% to 52.93 million cubic metres.
Historical Stock Returns for Bharat Coking Coal
| 1 Day | 5 Days | 1 Month | 6 Months | 1 Year | 5 Years |
|---|---|---|---|---|---|
| +5.27% | +2.18% | -0.79% | +0.58% | -19.30% | -19.30% |

What specific operational or geological factors are driving the 59.3% decline in underground mine output, and is this trend expected to persist?
How will the significant drop in progressive coking coal production (17.3% YoY) impact Bharat Coking Coal's revenue guidance for the current fiscal year?
Given the stable offtake despite lower production, how are inventory levels changing, and what does this imply for future pricing power?
 20
20












 Create Custom Screeners
  Access 200+ Pre-built Filters
  Use 50+ Readymade Screener





