

Ball Corp shares extend record 11-day winning streak in market rally


- Ball Corp achieved its longest daily winning streak in history with 11 consecutive up days.
- Stock gained over 13% since Oct 2, outperforming the S&P 500 which fell 0.3%.
- Q2 aluminum packaging volume grew 4.3% YoY, driving comparable EPS to $1.03.
- Analysts trimmed targets recently, with UBS setting a new target of $63 below current price.

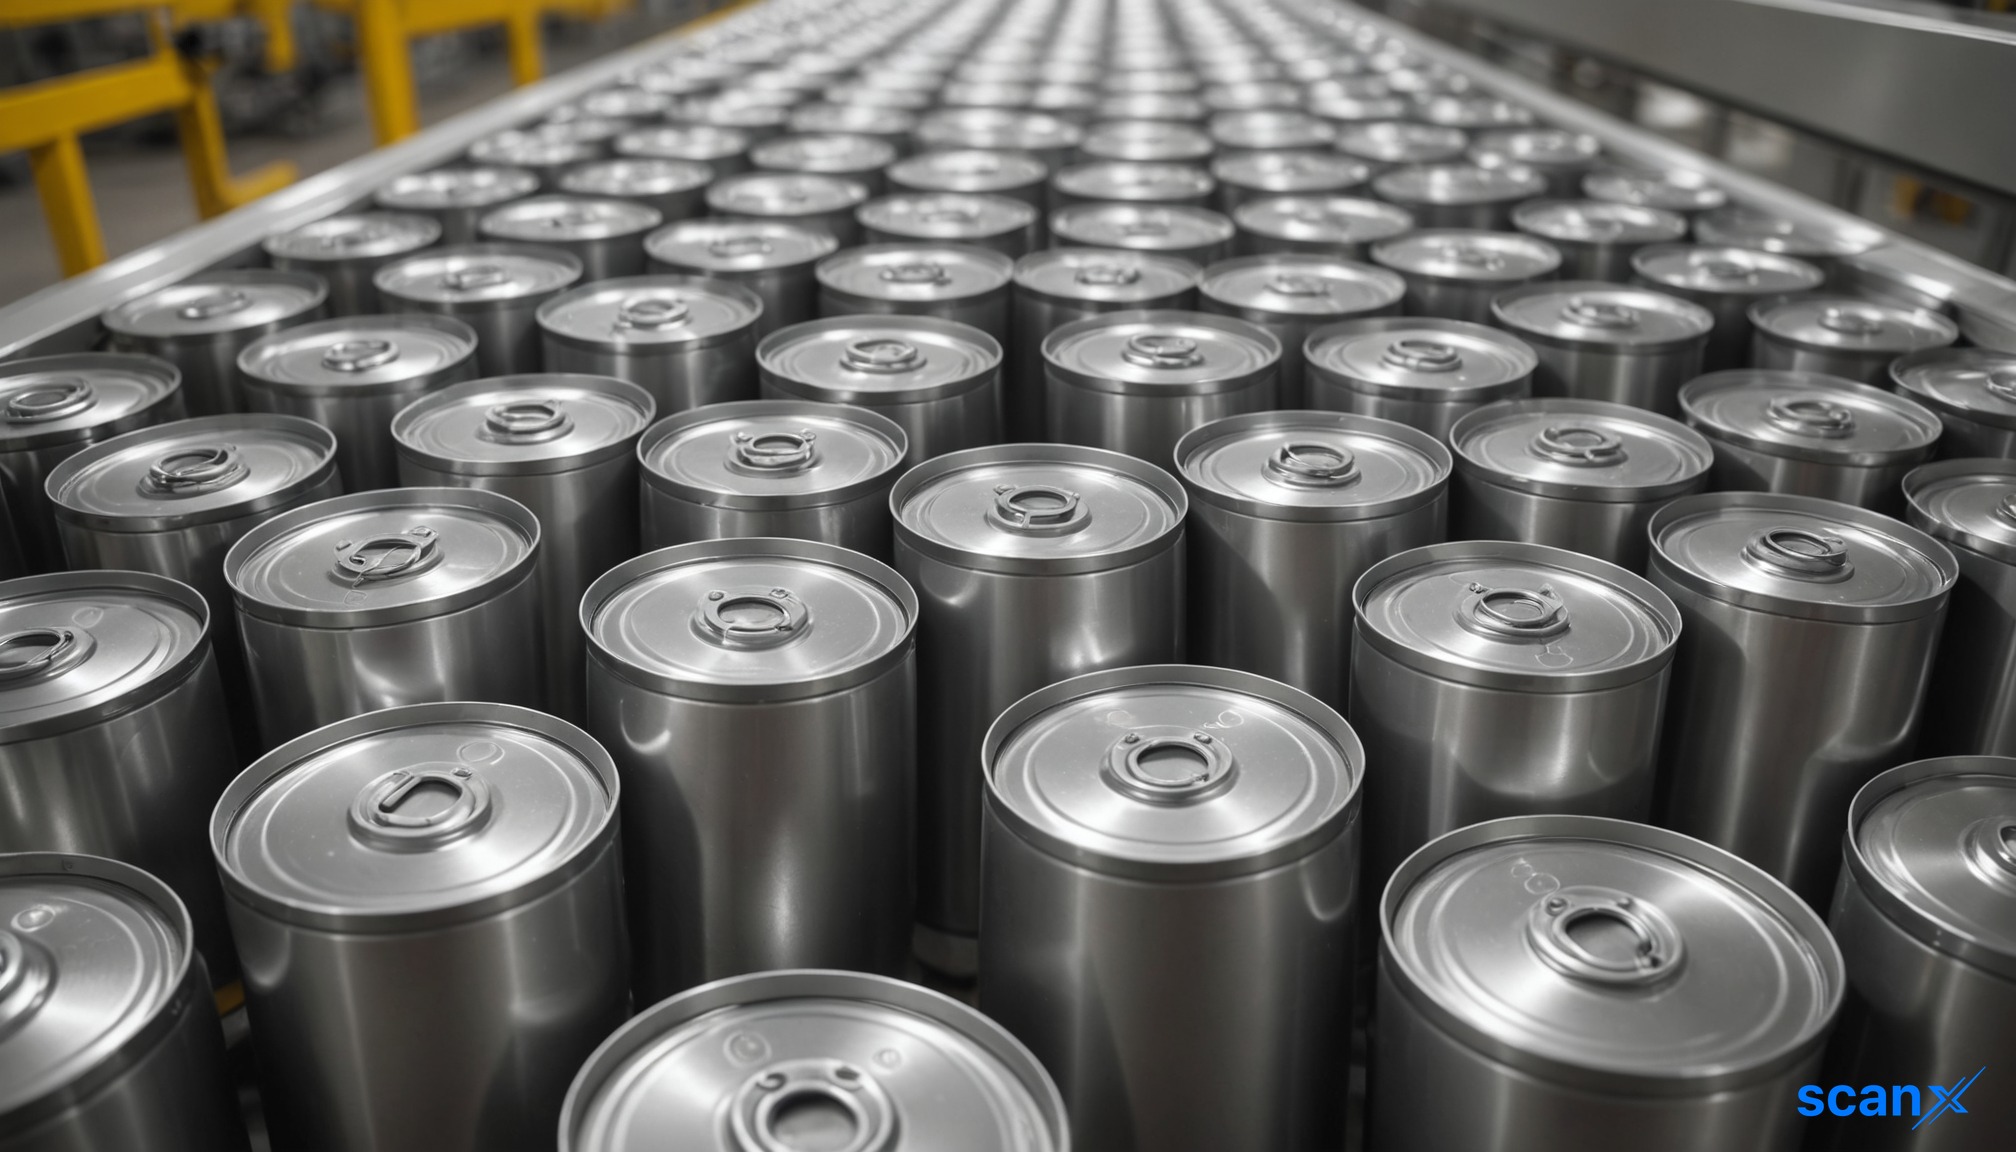

*this image is generated using AI for illustrative purposes only.
Ball Corp shares rose for an 11th consecutive session on Monday, achieving the longest daily winning streak in the company's history based on price data dating back to February 1973.
The stock traded near $64, gaining approximately 1.3% on the day. This performance contrasts with the broader market, as the S&P 500 slipped 0.3% over the same period since October 2, while Ball gained more than 13%. Year-to-date, Ball is up 20.4%, outpacing the S&P 500's 11.9% gain.
Market context and sector comparison
No other S&P 500 company currently holds a longer active winning streak. The table below highlights the top active streaks among major index constituents:
| Company | Streak | Gain during streak | Last time this long |
|---|---|---|---|
| Ball Corp | 11 days | +12.95% | Never (data since 1973) |
| Air Products and Chemicals Inc. | 8 days | +7.98% | October 2024 |
| Marriott International Inc. | 8 days | +10.02% | December 2023 |
| Linde PLC | 7 days | +4.22% | February 2026 |
| West Pharmaceutical Services Inc. | 7 days | +6.13% | August 2026 |
Source: TradingView, snapshot at 12:44 pm ET on Oct 19, 2026.
Aluminum prices and operational drivers
Aluminum futures on COMEX fell 9.3% in the past month to $3,121.25 per metric ton, while London Metal Exchange aluminum dropped 8.5% over the same period. Although Ball passes most aluminum costs to beverage brands through contracts, lower metal prices can enhance competitiveness against plastic and glass alternatives.
Volume growth remains a key driver. In the second quarter, Ball shipped 4.3% more aluminum packaging worldwide compared to the previous year. Comparable earnings per share, excluding one-off items, rose to $1.03 from 90 cents.
For 2026, the company expects comparable earnings per share to grow by more than 10%. It also projects free cash flow exceeding $900 million and plans to return at least $800 million to shareholders.
Analyst sentiment and valuation metrics
Despite the rally, analyst targets have trended lower recently. Three firms cut price targets during the streak while maintaining their ratings. UBS's new target of $63 sits below the current share price.
| Date | Firm | Price Target | Action | Rating |
|---|---|---|---|---|
| Oct 19, 2026 | Wells Fargo | $72 → $70 | Lowers | Overweight |
| Oct 13, 2026 | RBC Capital | $77 → $73 | Lowers | Outperform |
| Oct 5, 2026 | UBS | $66 → $63 | Lowers | Neutral |
| Sep 18, 2026 | JP Morgan | $65 | Upgrades | Neutral → Overweight |
| Aug 5, 2026 | UBS | $65 → $66 | Raises | Neutral |
| Aug 5, 2026 | Wells Fargo | $71 → $72 | Raises | Overweight |
Source: Benzinga Analyst Ratings.
Ball holds a consensus Buy rating from 14 analysts, with an average price target of $69, approximately 9% above Monday's trading level.
What the numbers show
A divergence exists between technical indicators and long-term valuation. The Relative Strength Index stands near 73, suggesting the stock is overbought in the short term. However, the share price remains 6% below its 52-week high of $68.29 and 38% below its all-time high of $102.76. This indicates that while momentum is strong, the stock has not yet recovered to historical peak valuations.

How might the continued decline in aluminum futures prices influence Ball Corp's long-term pricing power and contract renegotiation leverage with major beverage clients?
Given that UBS's price target is now below the current trading level, what specific operational or macroeconomic catalysts would be required to justify the consensus average target of $69?
To what extent is Ball Corp's record-breaking winning streak driven by sector-wide packaging rotation versus company-specific volume growth, and how sustainable is this momentum if broader market volatility increases?








 Create Custom Screeners
 Access 200+ Pre-built Filters
 Use 50+ Readymade Screener





