

Anand Seamless FY26 profit surges 107% to ₹548 lakh on volume growth


- Profit after tax rose 106.7% YoY to ₹547.8 lakh in FY26
- Revenue from operations jumped 66.9% to ₹5,600.4 lakh
- Sales of finished goods increased 23.7% to 2,658.4 tonnes
- EBITDA margin expanded by 67 bps to 18.2%
- Gross profit margin declined to 43.5% from 55.2% due to higher material costs

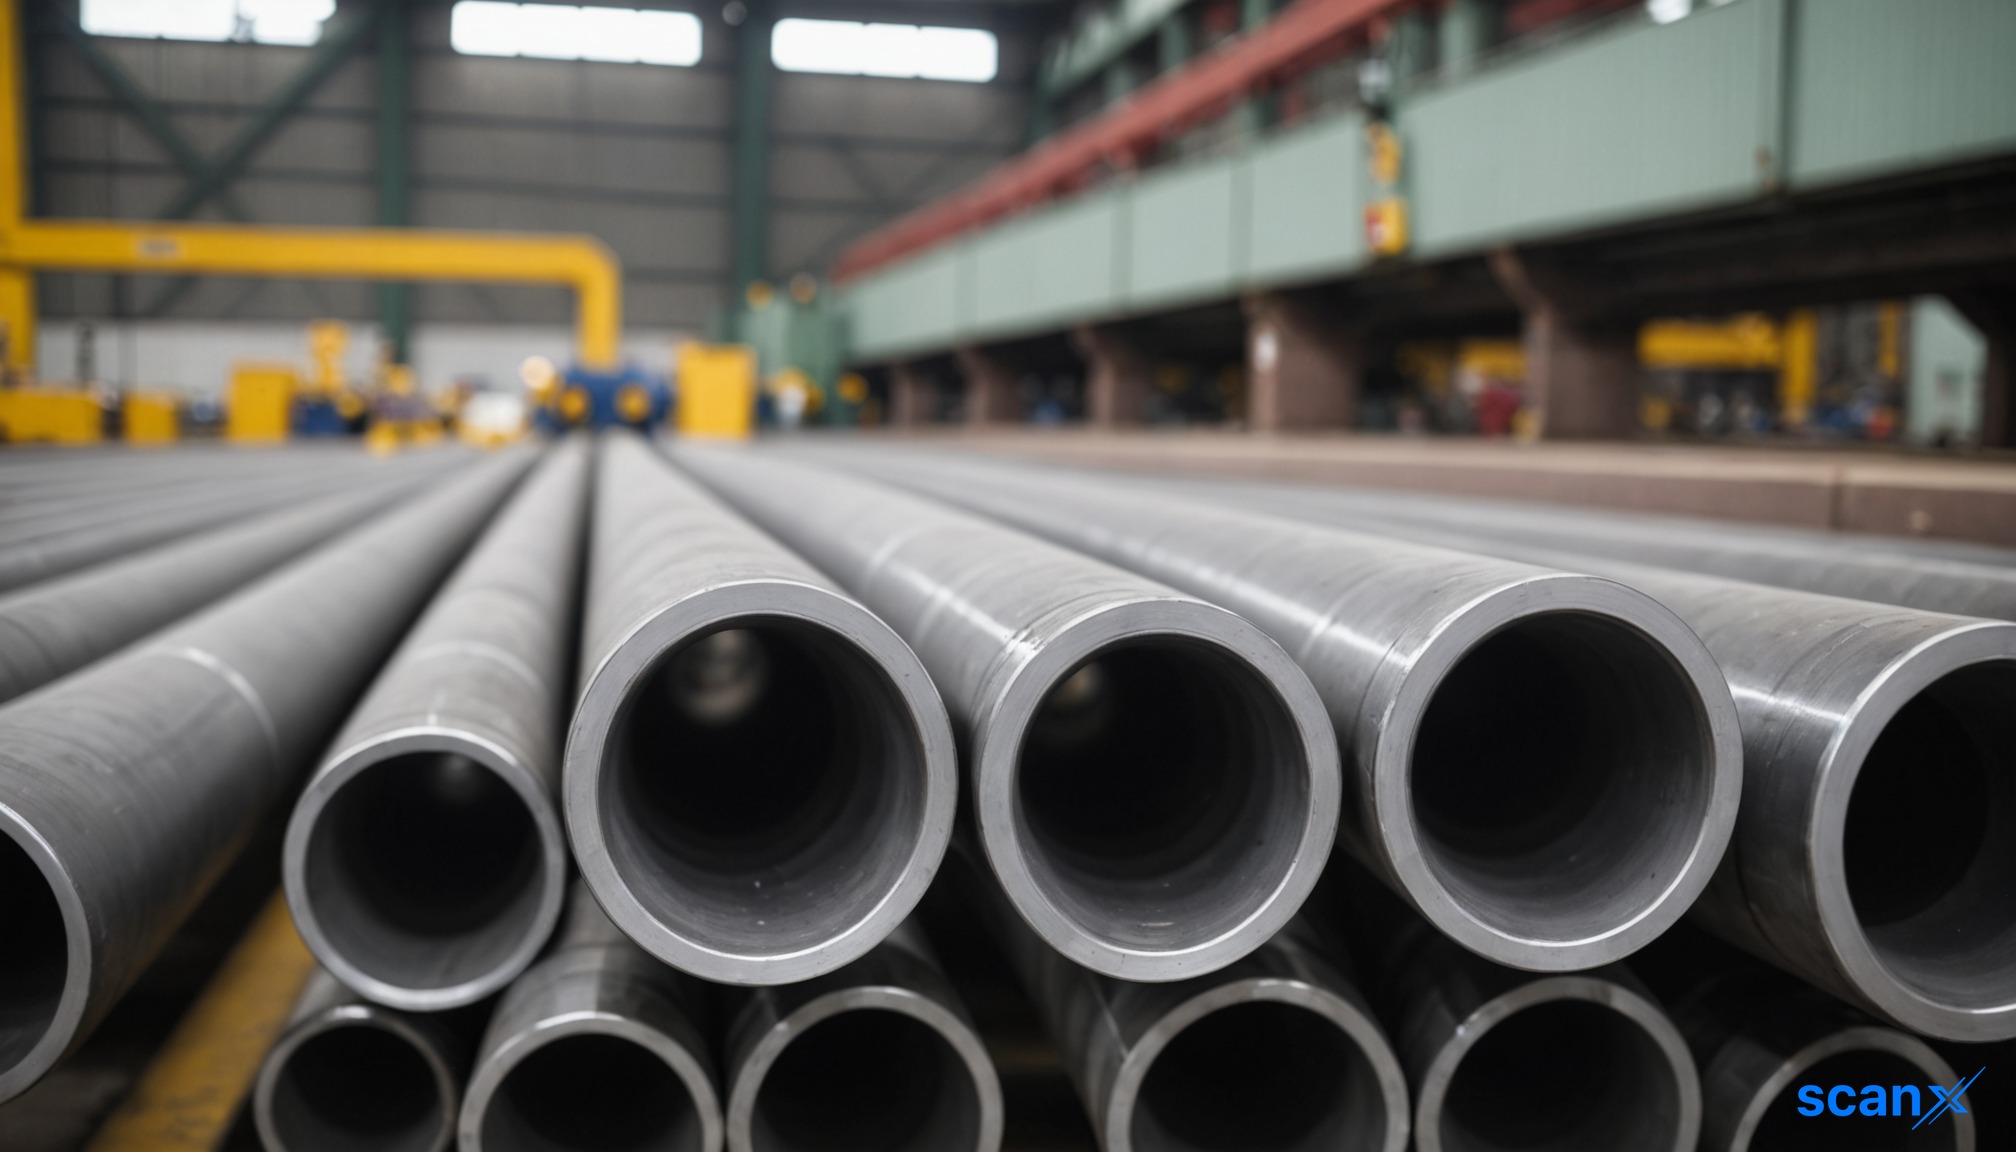

*this image is generated using AI for illustrative purposes only.
Anand Seamless Ltd reported a 106.7% year-on-year increase in profit after tax (PAT) to ₹547.8 lakh for FY26, driven by a 66.9% jump in revenue from operations.
The company’s top line expanded significantly to ₹5,600.4 lakh in FY26, up from ₹3,354.6 lakh in the previous fiscal year. This growth was supported by a 23.7% rise in sales of finished goods, which reached 2,658.4 tonnes compared to 2,148.7 tonnes in FY25. EBITDA also saw robust expansion, rising 73.3% to ₹1,022.0 lakh, with margins improving slightly to 18.2% from 17.6% in FY25.
Financial Performance Overview
The sharp improvement in profitability was accompanied by enhanced operational efficiency. Return on Equity (ROE) improved to 28.1% in FY26 from 18.9% in FY25, while Return on Capital Employed (ROCE) rose to 20.7% from 15.6%. The following table summarizes key financial metrics:
| Metric | FY26 | FY25 | Change |
|---|---|---|---|
| Revenue from Operations | ₹5,600.4 lakh | ₹3,354.6 lakh | +66.9% |
| EBITDA | ₹1,022.0 lakh | ₹589.7 lakh | +73.3% |
| EBITDA Margin | 18.2% | 17.6% | +67 bps |
| Profit After Tax (PAT) | ₹547.8 lakh | ₹265.1 lakh | +106.7% |
| PAT Margin | 9.8% | 7.9% | +188 bps |
| EPS (Restated) | ₹6.5 | ₹3.2 | +106.3% |
Operational Metrics and Capacity Utilization
Volume-led growth was a primary driver for the current fiscal year. Sales of finished goods increased consistently over the last three years, reflecting sustained market traction. Capacity utilization for the core seamless tubes and pipes segment improved markedly to 75% in FY26, up from 59% in FY25 and 43% in FY24. The finned tubes segment also witnessed an uptick in utilization, reaching 40% in FY26 compared to 30% in FY25.
Segment Mix and Geographic Reach
The business remains anchored by two key segments: Seamless Pipes & Tubes and Finned Tubes. In FY26, Seamless Tubes & Pipes contributed 67% to total revenue, while Finned Tubes accounted for 31%. Geographically, Gujarat continued to be the largest domestic market, contributing 57.5% of domestic revenue, followed by Maharashtra at 18.7%. On the export front, the United Arab Emirates remained the top destination, accounting for 25.6% of export revenue, followed closely by the Sultanate of Oman at 24.7%.
What the Numbers Show
A divergence between revenue growth and gross profit margin highlights changing cost dynamics. While revenue surged 66.9%, the gross profit margin contracted to 43.5% in FY26 from 55.2% in FY25. This compression occurred despite EBITDA margin expansion, suggesting that while operating leverage improved on fixed costs, the cost of material consumed rose disproportionately faster than revenue, increasing by 110.6% year-on-year. This indicates potential input cost pressures or a shift in product mix towards lower-margin items within the high-volume growth phase.
Historical Stock Returns for Anand Seamless
| 1 Day | 5 Days | 1 Month | 6 Months | 1 Year | 5 Years |
|---|---|---|---|---|---|
| 0.0% | 0.0% | 0.0% | 0.0% | 0.0% | 0.0% |

How will Anand Seamless plan to mitigate the disproportionate 110.6% rise in raw material costs to prevent further gross margin compression in FY27?
With capacity utilization at 75% for seamless tubes, what are the company's specific capital expenditure plans for expanding production capacity to meet future demand?
What strategies is the management implementing to diversify geographic revenue beyond the heavy reliance on Gujarat, UAE, and Oman markets?
 19
19





 Access Market Heat-map & Insights
  Create, Save & Share your Screener
  Use 200+ Screening Filters





