Faze Three Hits 20% Upper Circuit on India-US Trade Deal Optimism


Faze Three Ltd., a home interior products manufacturer, saw its stock hit the 20% upper circuit at ₹547.00. The surge is attributed to potential India-US trade talks, benefiting the company which derives 57% of its revenue from US exports. Trading volume increased significantly, with 6.5 lakh shares traded in the first hour. The company's market cap reached ₹1,330.00 crore. However, CARE Ratings placed the company's credit rating under 'Rating Watch with Negative Implications' due to new US tariffs on textile imports from India.

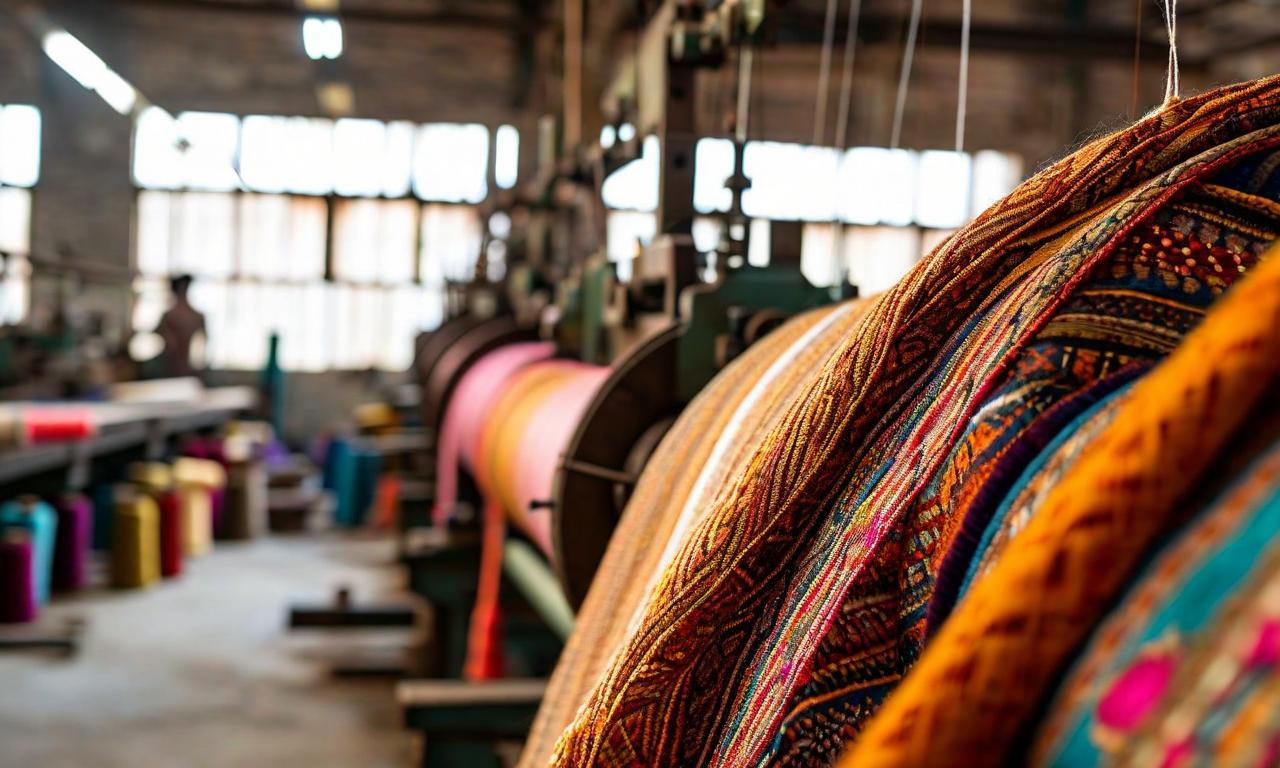
*this image is generated using AI for illustrative purposes only.
Faze Three Ltd., a prominent home interior products manufacturer and exporter, saw its stock price surge to the 20% upper circuit limit at ₹547.00 amid growing optimism surrounding potential India-US trade talks. The company, which generates 90% of its revenue from exports to US, EU, and UK markets, with 57% coming specifically from the US, found itself at the center of investor attention.
Market Performance
The stock's impressive rally was accompanied by a surge in trading volume, with 6.5 lakh shares changing hands in the first hour of trading, significantly outpacing the 20-day average of 31,000 shares. This surge in interest pushed Faze Three's market capitalization to ₹1,330.00 crore.
Trade Talk Optimism
The positive sentiment was fueled by encouraging statements from US President Donald Trump and Indian Prime Minister Narendra Modi, who expressed a positive outlook on continuing trade discussions between the two nations. This development has sparked hope for improved trade relations, potentially benefiting companies like Faze Three that have a substantial export presence in the US market.
Company Overview
Faze Three Ltd., founded in 1985, has established itself as a key player in the home and technical textiles industry. The company boasts a diverse product portfolio, including:
- Bathmats and bathrugs
- Blankets
- Mats
- Chairpads
- Carpets
- Beach towels
- Other top-of-the-bed products
With manufacturing units in Panipat, Silvassa, and Vapi, Faze Three has built a strong reputation in the global market, particularly in the US, UK, and major European countries.
Ownership Structure
The company's ownership structure reveals:
- Promoter holding: 57%
- Ashish Kacholia's stake: 5.42% (valued at approximately ₹72.00 crore)
Notably, the company currently has no institutional holdings or analyst coverage.
Recent Financial Performance
According to the latest available financial data, Faze Three reported:
| Metric | FY25 | FY24 |
|---|---|---|
| Consolidated Total Operating Income | ₹689.94 crore | ₹564.52 crore |
| PBILDT | ₹89.93 crore | - |
| PAT | ₹40.64 crore | - |
Credit Rating Reaffirmation
CARE Ratings Ltd. has reaffirmed Faze Three's Long-term & Short-term Bank Facilities rating at CARE A / CARE A1. However, the ratings have been placed under 'Rating Watch with Negative Implications' due to uncertainty surrounding the impact of additional 25% tariffs levied by the US Government on textile imports from India, effective August 27.
Outlook and Challenges
While the company's financial risk profile remains comfortable with an adjusted overall gearing of 0.56x, the potential impact of the new US tariffs on Faze Three's revenue and profitability remains a key concern. The company's high geographical concentration, with over 50% of revenue coming from US exports, exposes it to risks arising from evolving demand prospects in the US market.
As the textile industry navigates through these challenging times, Faze Three's ability to adapt to changing market dynamics and potentially diversify its geographical presence will be crucial in maintaining its growth trajectory and financial stability.
The stock's recent surge reflects investor optimism, but the company's performance in the coming quarters will be closely watched as it deals with the potential implications of the new tariff structure and global trade dynamics.
Historical Stock Returns for Faze Three
| 1 Day | 5 Days | 1 Month | 6 Months | 1 Year | 5 Years |
|---|---|---|---|---|---|
| -1.37% | -1.48% | -10.35% | +43.45% | -21.52% | +75.19% |
 18
18