NewsBank Nifty Surges 677 Points to Reclaim 59,500 on US Ambassador's India Trade Partnership Comments
Bank Nifty Surges 677 Points to Reclaim 59,500 on US Ambassador's India Trade Partnership Comments


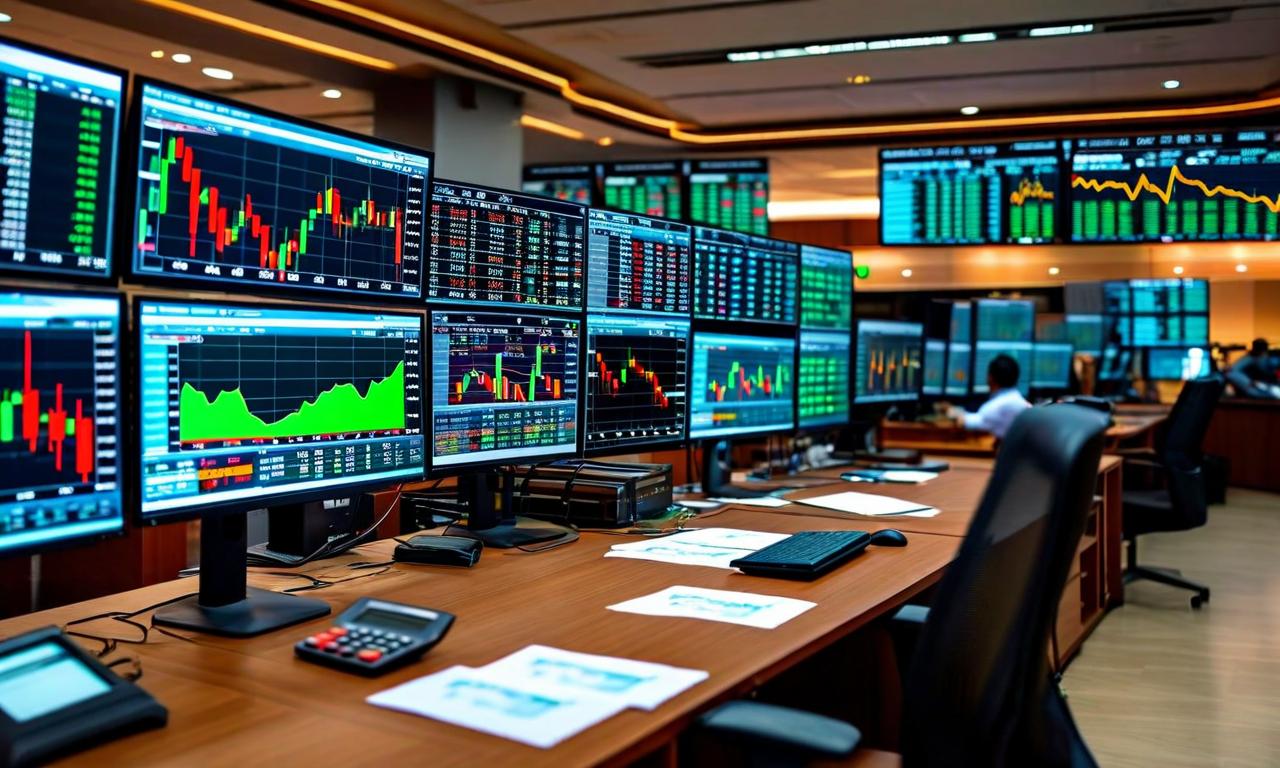
Bank Nifty staged a dramatic 677-point recovery on January 12 to reclaim 59,500 levels after US Ambassador Sergio Gor's positive comments about India-US trade partnership. IndusInd Bank led gains with over 2% rise, while ICICI Bank, SBI, and other major banks posted around 1% gains. Technical analysts view 59,500 as a crucial resistance level with upside potential to 60,000 if sustained.

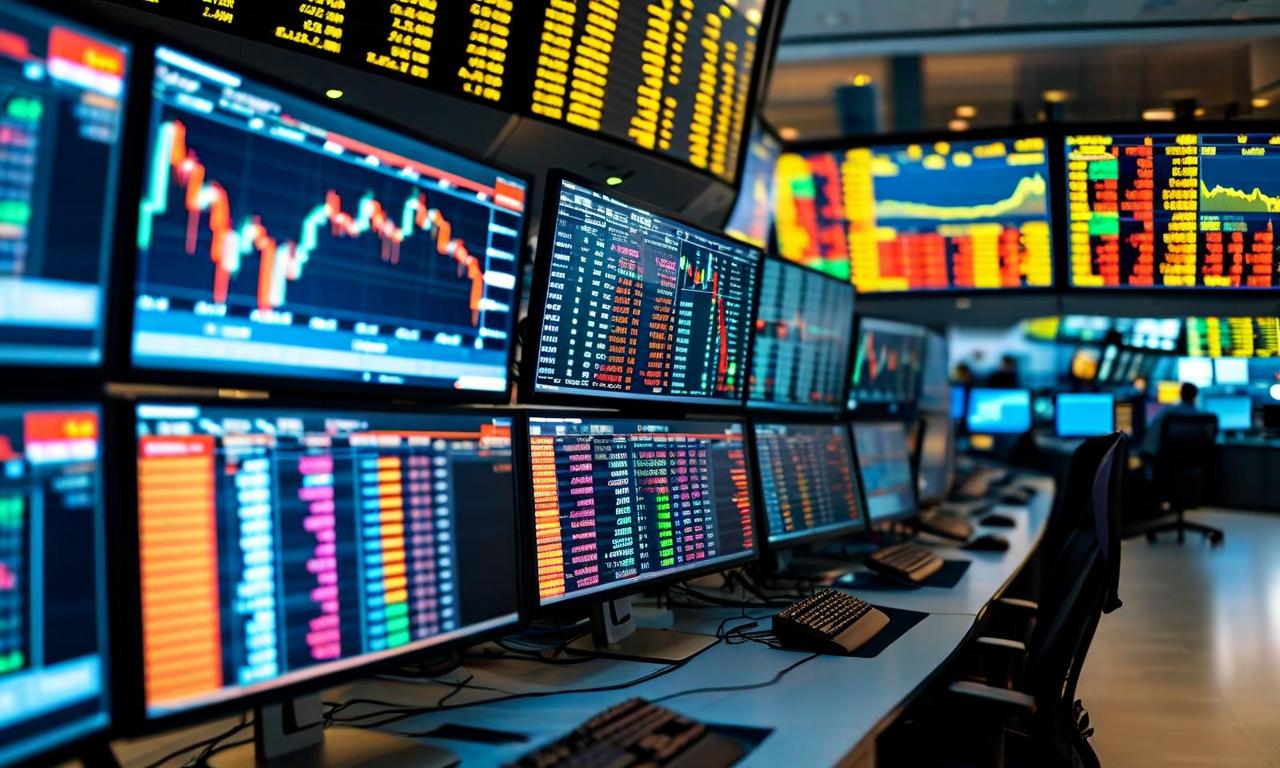
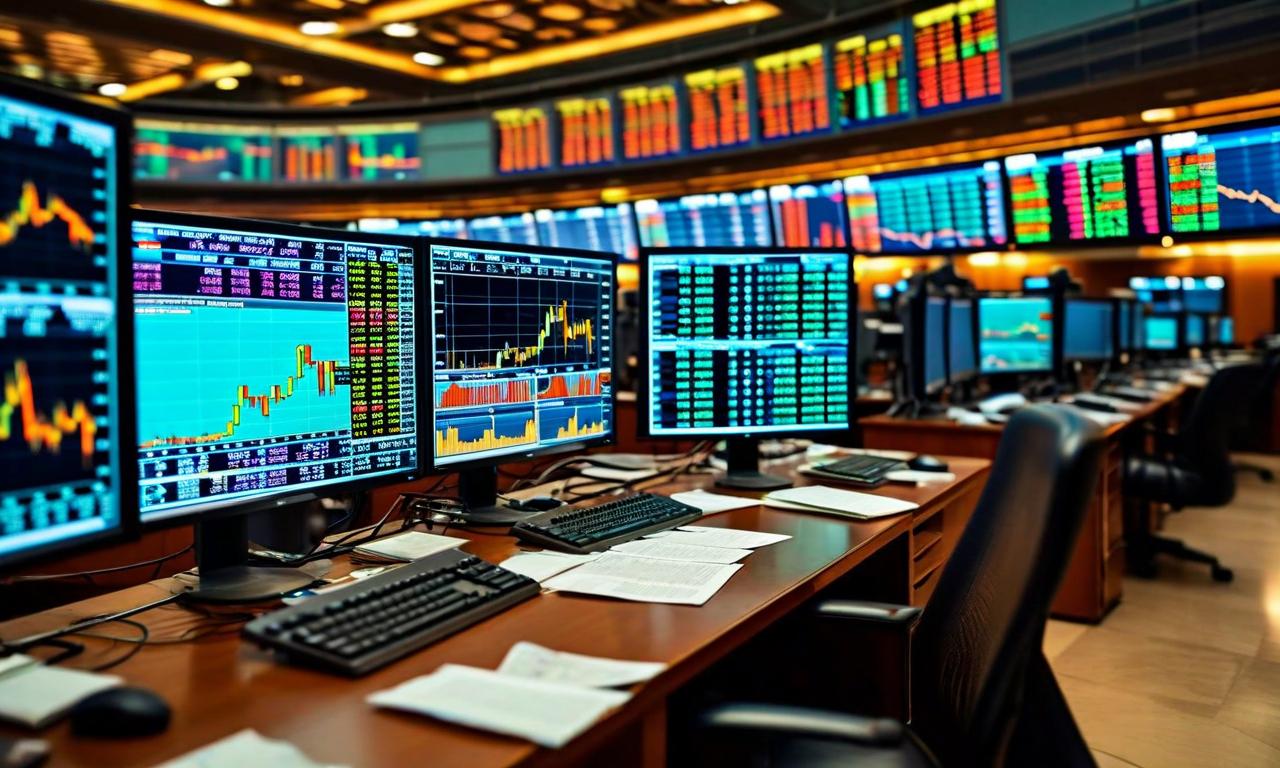
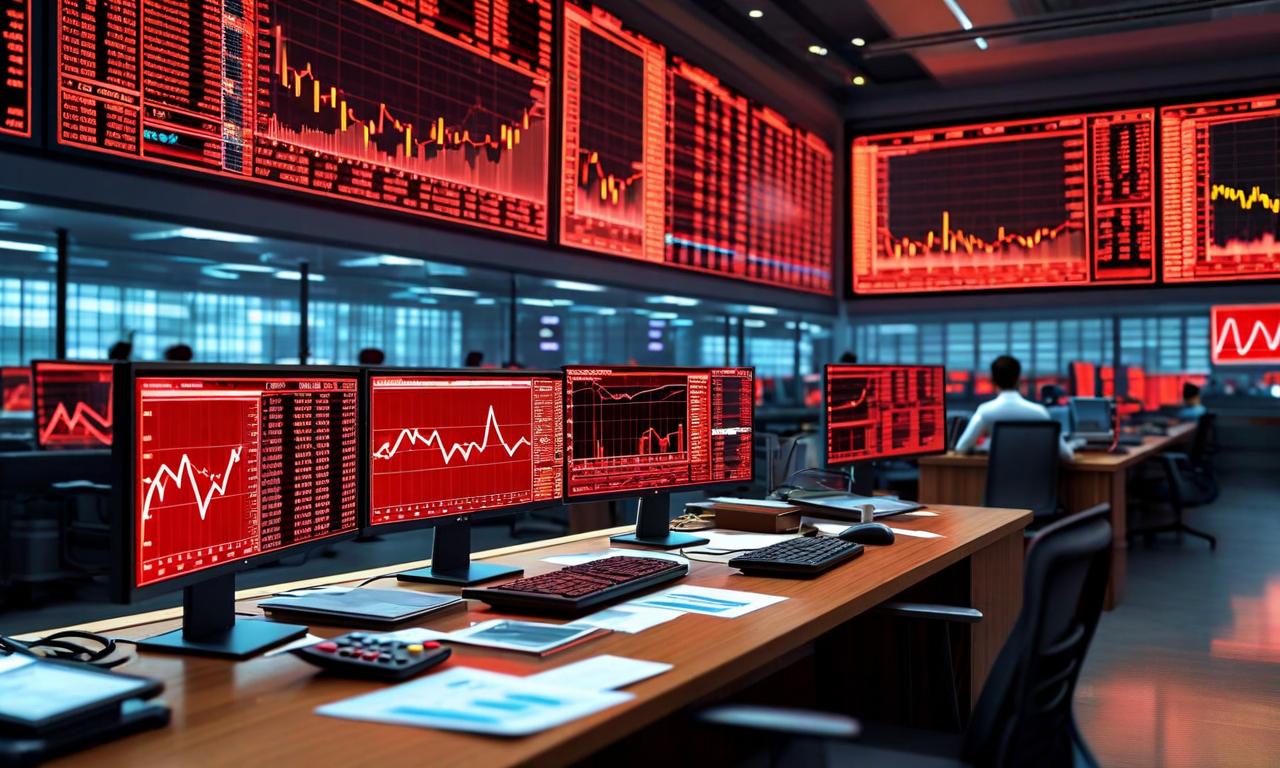
*this image is generated using AI for illustrative purposes only.
The Nifty Bank index demonstrated remarkable resilience on January 12, staging a sharp recovery from intraday lows following positive comments from US Ambassador to India Sergio Gor regarding the India-US trade partnership. The index surged approximately 677 points during the session to reach its day's high of 59,540.95, successfully reclaiming the psychologically important 59,500 level.
US Ambassador's Market-Moving Comments
The market rally was triggered by Ambassador Gor's optimistic remarks about the bilateral relationship between India and the United States. Speaking during his assumption of charge in New Delhi on Monday, Gor emphasized that there is "no partner more essential than India" to the Trump-led administration. His comments provided much-needed clarity on the trade relationship that has been a source of market concern.
| Key Statements: | Details |
|---|---|
| Partnership Status: | India described as "essential partner" |
| Trade Deal Timeline: | Next call scheduled for following day |
| Presidential Visit: | Trump expected to visit India in 1-2 years |
| Bilateral Engagement: | Both countries continue active discussions |
Gor also conveyed Trump's best wishes to Prime Minister Narendra Modi, describing their relationship as genuine and noting that "real friends can disagree, but resolve the difference." He framed current trade negotiations as part of a broader, resilient partnership and referenced strategic initiatives like Pax Silica, calling it a US-led framework with India as a key partner.
Banking Sector Performance
The positive sentiment translated into broad-based gains across major banking stocks, with several institutions posting significant advances during the session.
| Top Performers: | Gain (%) |
|---|---|
| IndusInd Bank: | Over 2.00% |
| ICICI Bank: | Over 1.00% |
| State Bank of India: | Nearly 1.00% |
| AU Small Finance Bank: | Nearly 1.00% |
| Yes Bank: | Nearly 1.00% |
| Union Bank of India: | Nearly 1.00% |
Kotak Mahindra Bank and HDFC Bank also traded in positive territory with marginal gains. However, some banks bucked the trend, with Punjab National Bank, Axis Bank, Bank of Baroda, Canara Bank, IDFC First Bank, and Federal Bank declining by up to 1%.
Technical Analysis and Key Levels
Market analysts have identified several crucial technical levels for Bank Nifty following the day's recovery. According to Axis Direct, the trend-deciding level for the index was 59,382, which has now been successfully crossed.
| Technical Outlook: | Levels |
|---|---|
| Immediate Resistance: | 59,500-59,600 |
| Upside Targets: | 59,609-59,967-60,195 |
| Key Support: | 59,000 |
| Downside Levels: | 58,800-58,500 |
Shrikant Chouhan from Kotak Securities highlighted that the 20-day SMA at 59,500 would act as a key level for traders. Below this mark, the correction wave is likely to continue until 58,800–58,500, while above 59,500, the index could bounce back up to 59,800–60,000.
Market Sentiment and Outlook
Sunny Agrawal, head of fundamental equity research at SBICAPS Securities, attributed the recovery to the "positive statement by U.S. ambassador on continuation of talks on India-U.S. trade deal and reiteration of the importance of India as a trade partner," which led to short covering during the day.
The India-US trade deal has experienced significant delays, creating market pressure for most of 2025 amid concerns about rising Trump tariffs. Analysts had previously noted that markets could see rallies on any positive news regarding trade negotiations, which materialized with Gor's comments.
Senator Marco Rubio's additional comment that "this year will be a year of reciprocity" further reinforced the mutual intent to enhance cooperation across trade and strategic sectors, providing additional support to market sentiment.
 20
20