Solex Energy Shares Jump 6% After Securing ₹276 Crore Solar Module Order


Solex Energy Limited's shares surged 6.09% to ₹1,187.90 following a ₹276 crore order win for high-efficiency TOPCon solar PV modules. The order from a domestic power producer includes 615 Wp and 620 Wp modules for execution between February-May 2026. With revenue growing 17.66% to ₹155.02 crore in H1 FY26 and ambitious targets to reach ₹3,300 crore by FY27, the company maintains a strong order book of over ₹4,000 crore and serves diversified clients across energy and industrial sectors.

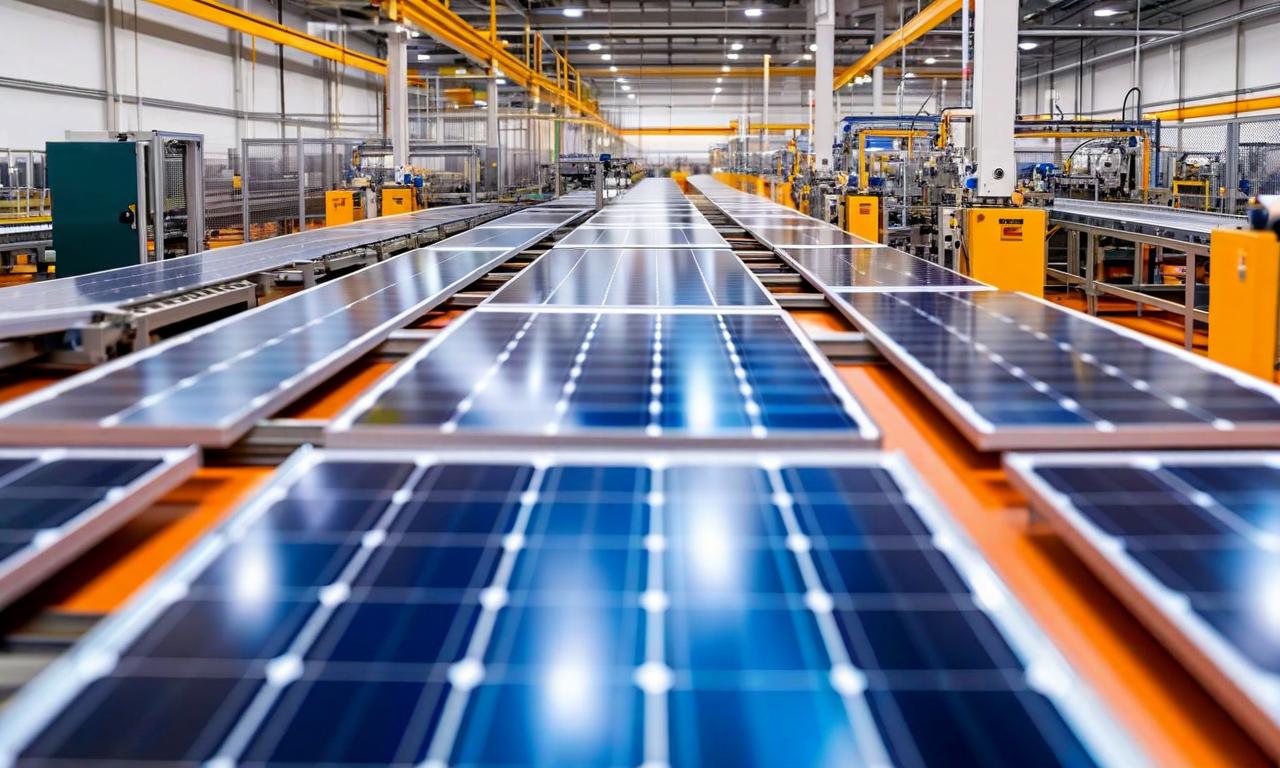
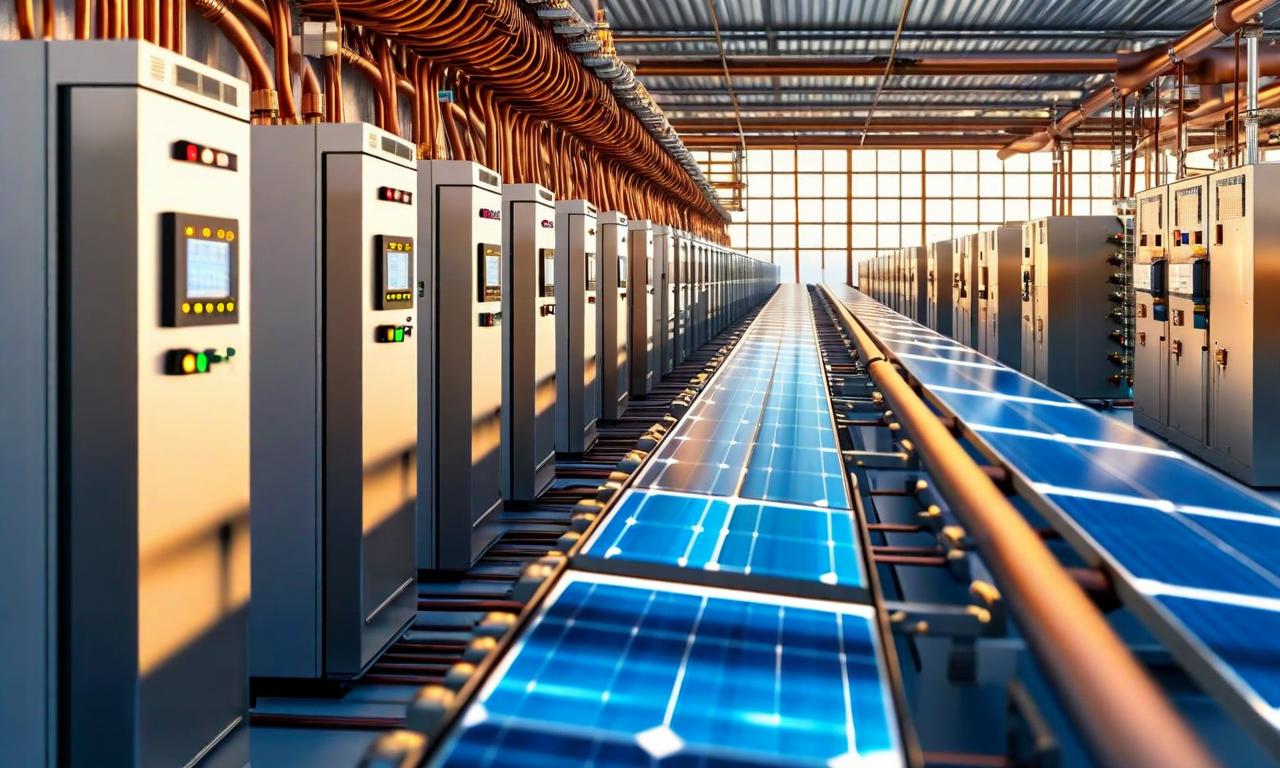
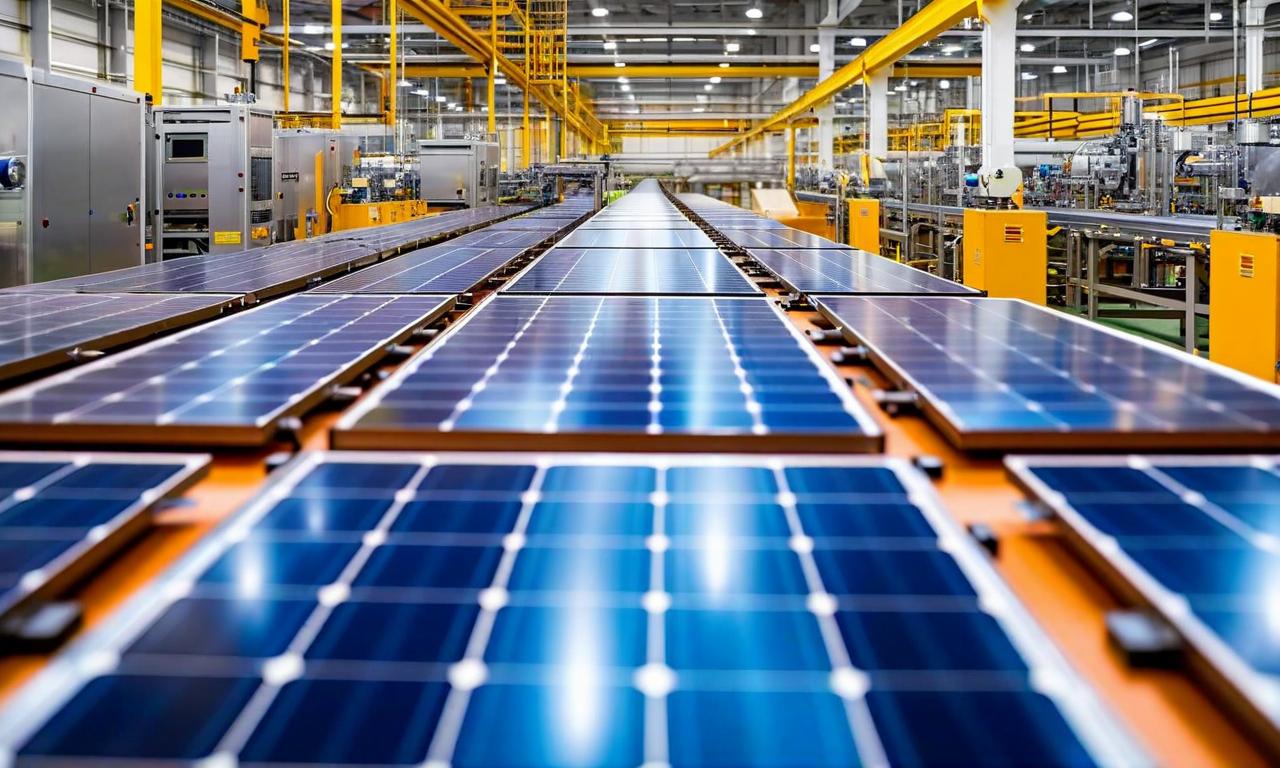
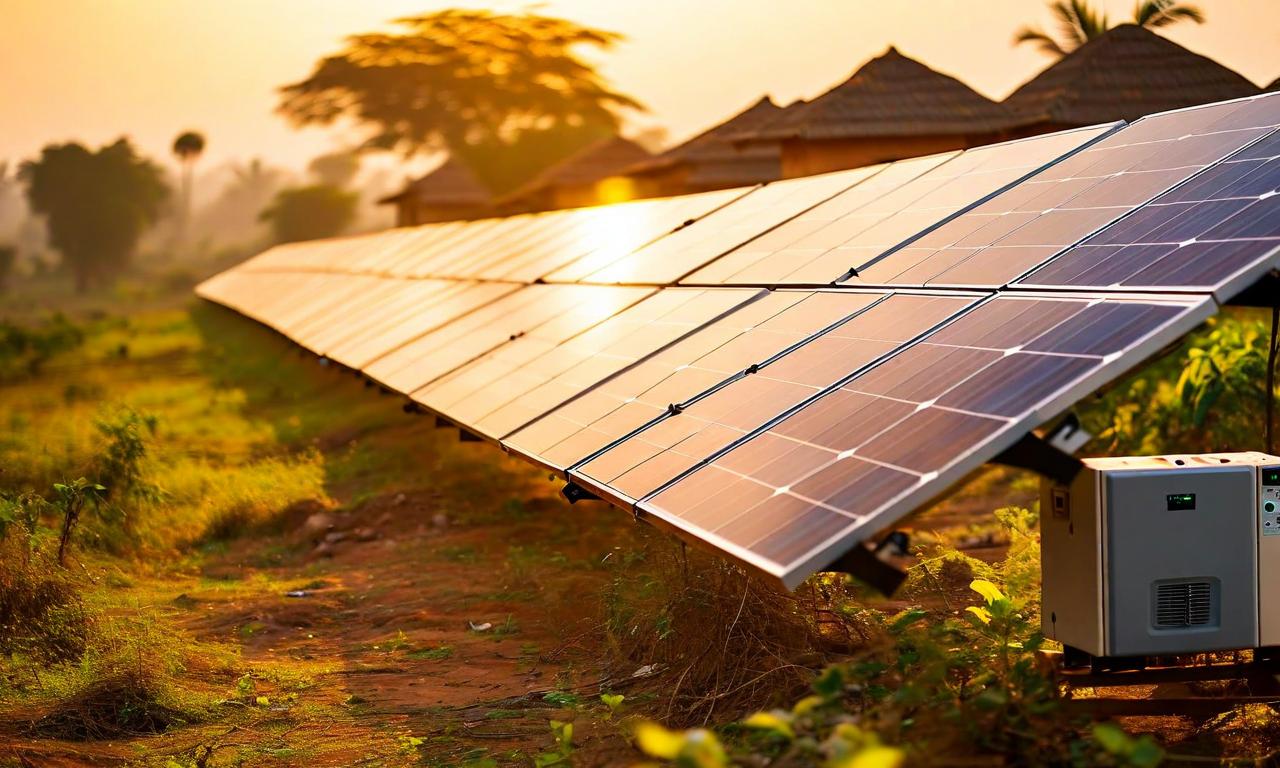
*this image is generated using AI for illustrative purposes only.
Solex Energy Limited's shares experienced a significant surge of 6.09% following the announcement of a substantial work order worth ₹276 crore for solar photovoltaic modules. The stock reached an intraday high of ₹1,187.90 per share, rising from the previous day's closing price of ₹1,119.70, before retreating to ₹1,162.50.
Major Order Win Drives Market Confidence
The company secured a significant work order worth ₹276 crore from a reputed domestic independent power producer for manufacturing and supplying high-efficiency N-Type TOPCon solar PV modules. The order encompasses both 615 Wp and 620 Wp glass-to-glass (G12R) modules, recognized for their superior performance and durability characteristics.
| Order Details: | Specifications |
|---|---|
| Order Value: | ₹276 crore |
| Module Types: | 615 Wp and 620 Wp TOPCon |
| Technology: | N-Type glass-to-glass (G12R) |
| Execution Period: | February to May 2026 |
| Client Type: | Domestic independent power producer |
Strong Financial Performance and Growth Trajectory
Solex Energy Limited has demonstrated impressive long-term returns, delivering over 4,104.55% returns to investors over the past five years. The company's recent financial performance shows mixed results in the first half comparison.
| Financial Metrics: | H1 FY25 | H1 FY26 | Growth (%) |
|---|---|---|---|
| Revenue: | ₹131.75 crore | ₹155.02 crore | +17.66% |
| Net Profit: | ₹9.08 crore | ₹5.79 crore | -36.23% |
Despite the recent decline in net profit, the company has achieved remarkable growth over the past two years, with revenue and net profit growing at a CAGR of 102.15% and 278.59% respectively.
Ambitious Revenue Projections and Expansion Plans
The management has outlined aggressive growth targets, aiming to nearly quadruple revenue by FY27. The company expects substantial revenue expansion supported by capacity additions and improved utilization rates.
| Revenue Projections: | Amount |
|---|---|
| FY25 (Expected): | ₹662.20 crore |
| FY26 (Target): | ₹2,000.00 crore |
| FY27 (Target): | ₹3,300.00 crore |
Profitability improvements are also projected, with PAT expected to increase from ₹42.80 crore in FY25 to ₹120-160 crore in FY26, and further to ₹264-330 crore by FY27. PAT margins are anticipated to improve to 6-8% in FY26 and 8-10% in FY27.
Strong Market Position and Diversified Client Base
Solex Energy Limited has established a robust market presence with a 4 GW module manufacturing capacity and over 15 domestic and international certifications. The company maintains a strong order book exceeding ₹4,000 crore as of September 30, 2025, and has successfully shipped more than 3 million solar modules across over 10,000 projects.
The company serves a diversified client portfolio including:
- Industrial clients: Amul, Banco Aluminium, Tata Group entities
- Energy sector: Adani Group entities, Torrent Power, ONGC, GAIL
- Government bodies: Indian Railways, NPCIL, various state electricity boards
- Renewable energy agencies: GEDA, SPRERI, CREDA
Company Fundamentals and Market Metrics
With a market capitalization of ₹1,228.89 crore, Solex Energy Limited demonstrates strong return ratios with ROCE at 29.90% and ROE at 40.60%. The company reports an earnings per share of ₹54.00 and maintains a debt-to-equity ratio of 1.57x. Founded in 1995 and headquartered in Surat, Gujarat, the company operates a 1.5 GW manufacturing facility and aims to scale up to 10 GW each of solar module and solar cell capacity under its Vision 2030 growth plan.
Historical Stock Returns for Solex Energy
| 1 Day | 5 Days | 1 Month | 6 Months | 1 Year | 5 Years |
|---|---|---|---|---|---|
| -2.93% | -7.11% | -17.21% | -8.32% | -35.99% | +1,704.35% |
 19
19