Meghmani Organics Submits Q3FY26 Investor Presentation Under SEBI Regulations


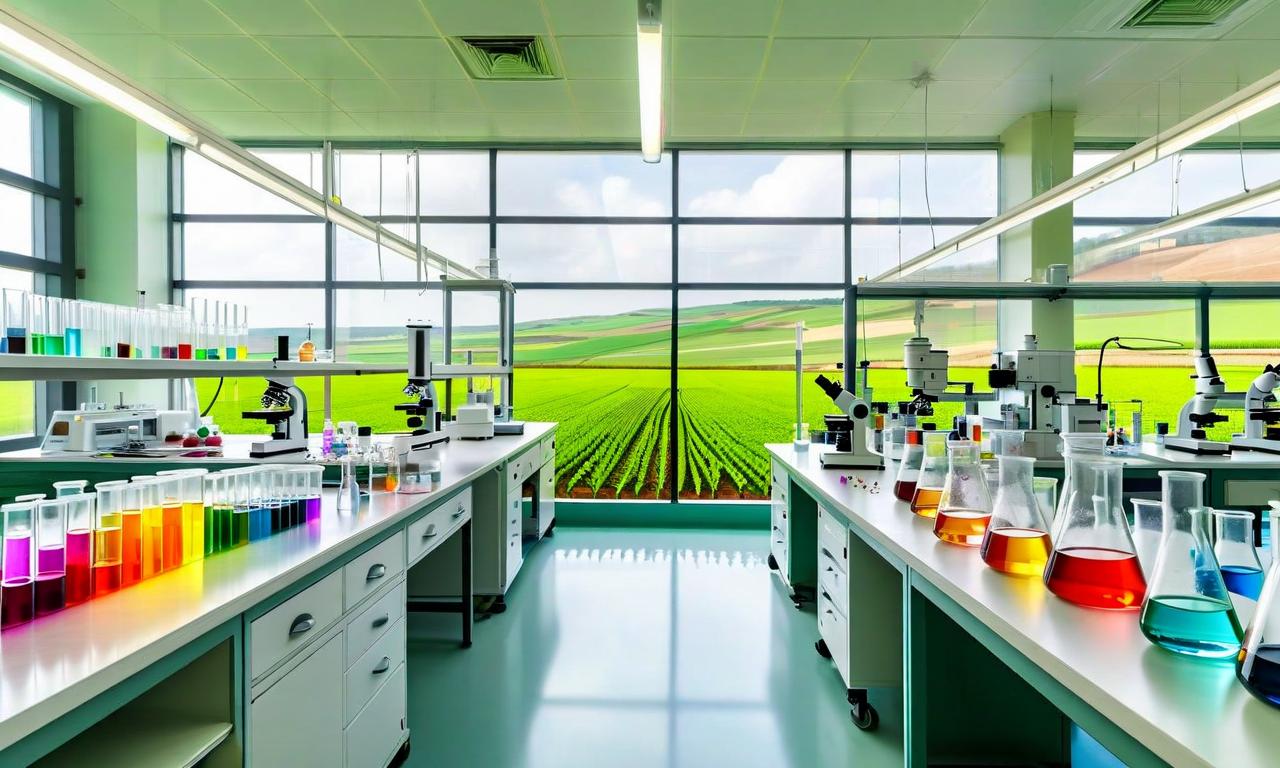
Meghmani Organics Limited has filed its comprehensive Q3FY26 investor presentation with stock exchanges under SEBI regulations, showcasing the company's 39-year legacy as an integrated diversified chemical company with global operations across 75+ countries and four key business verticals including Crop Protection, Pigments, Titanium Dioxide, and Crop Nutrition.


*this image is generated using AI for illustrative purposes only.
Meghmani Organics Limited has submitted its investor presentation on Q3FY26 financial results to stock exchanges under Regulation 30 of SEBI (LODR) Regulations, 2015. The presentation covers the company's unaudited financial results for the quarter and nine months ended December 31, 2025.
Regulatory Compliance and Disclosure
The investor presentation was submitted by Company Secretary & Compliance Officer Jayesh Patel on January 31, 2026. The comprehensive document is also available on the company's website at www.meghmani.com for stakeholder access.
| Filing Details: | Information |
|---|---|
| Regulation: | SEBI (LODR) Regulations, 2015 - Regulation 30 |
| Filing Date: | January 31, 2026 |
| Period Covered: | Quarter and Nine months ended December 31, 2025 |
| Company Secretary: | Jayesh Patel (Mem.No: A14898) |
Business Overview and Diversified Portfolio
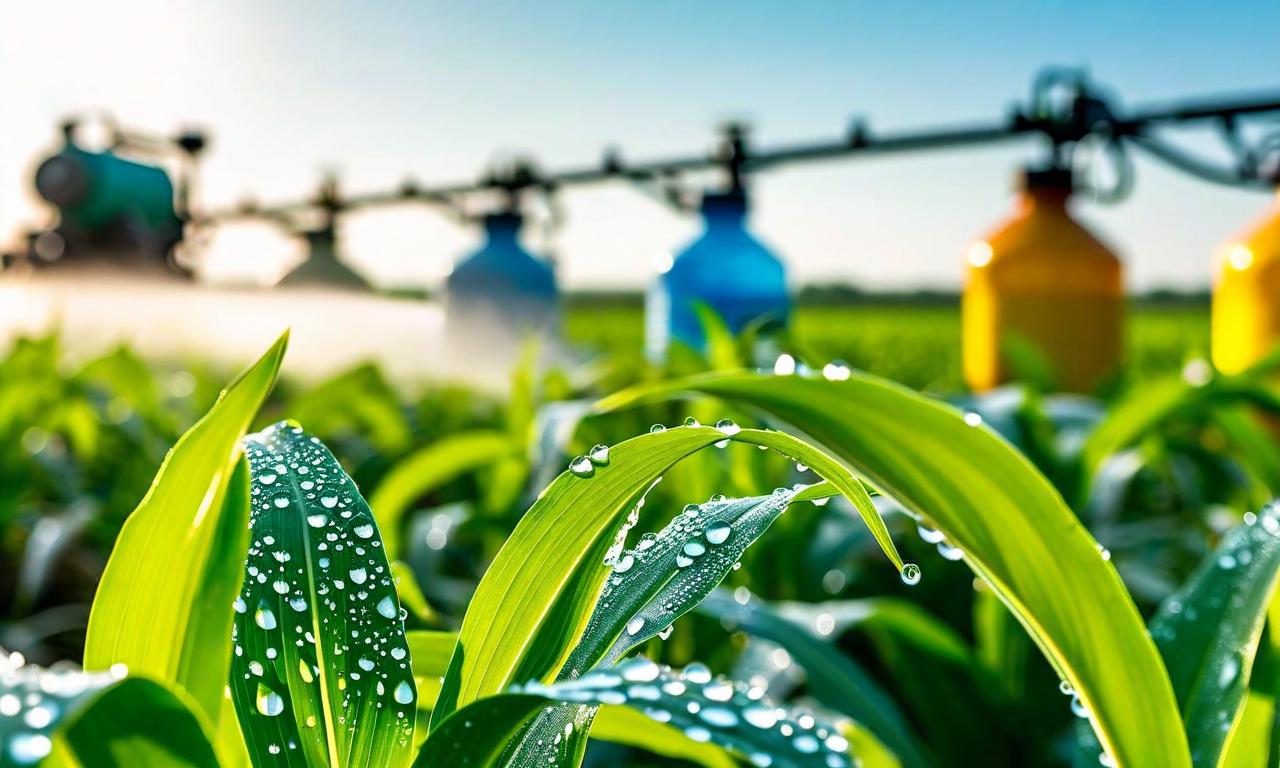
The presentation highlights Meghmani Organics as an integrated diversified chemical company with global footprint, boasting 39 years of chemical industry experience. The company operates across four key business verticals: Crop Protection, Pigments, Titanium Dioxide (TiO₂), and Crop Nutrition.
| Business Metrics: | Details |
|---|---|
| Manufacturing Facilities: | 9 integrated facilities |
| Global Presence: | 75+ countries served |
| Renewable Energy Contribution: | 38.90% |
| Distribution Network: | 3,500+ distributors and dealers across India |
| GLP Lab: | 1 accredited facility |
Segment-wise Operations Structure
The company's diversified operations span multiple manufacturing locations with specialized facilities for each business vertical. The Crop Protection segment operates from Ankleshwar, Panoli & Dahej with 4 manufacturing facilities, while Pigments operations are based at Vatva, Panoli, Dahej SEZ with 3 facilities.
| Segment: | Manufacturing Locations | Facilities | Key Products |
|---|---|---|---|
| Crop Protection: | Ankleshwar, Panoli & Dahej | 4 | Intermediates, technical and formulations |
| Pigments: | Vatva, Panoli, Dahej SEZ | 3 | Alpha Blue, Beta Blue, Pigment Green, CPC |
| Crop Nutrition: | Sanand | 1 | Nano fertiliser, biostimulant, micronutrient |
| Titanium Dioxide: | Dahej | 1 | Anatase grade |
Leadership and Governance Structure
The presentation outlines the company's leadership team headed by Chairman & Managing Director Ankit Patel, who brings over a decade of chemical industry experience and holds degrees in Chemical Engineering and Global MBA. The board includes Executive Directors Karana Patel and Darshan Patel, along with several independent directors including Padmashri Awardee Prof. (Dr.) Ganapati Yadav.
Market Position and Investment Highlights
Meghmani Organics serves approximately 10 million Indian farmers through its extensive network and maintains global presence across 75+ countries including Africa, Brazil, LatAm, US and Europe. The company's Crop Protection segment receives 45% demand from US & Brazil markets, while maintaining 90% business from repeat clients in the Pigments segment.
Source: SEBI Filing