NewsManorama Industries Reports 86.4% Revenue Growth, Revises Annual Guidance Upward to INR 1,150 Crores
Manorama Industries Reports 86.4% Revenue Growth, Revises Annual Guidance Upward to INR 1,150 Crores


Manorama Industries Limited reported robust financial results for H1 FY26, with consolidated revenue of 612.90 crores, up 86.4% YoY. The company revised its annual guidance upward to INR 1,150 crores plus for FY26. Manorama plans to increase capacity from 40,000 to 52,000 metric tons annually and has announced INR 450 crores in capital expenditure for expansion projects. The company is establishing subsidiaries in West Africa, expanding into Latin America, and has signed an MoU with the Government of Chhattisgarh for potential future investments. Manorama's top customers include global giants like Mondelez, Nestle, and Hershey's.
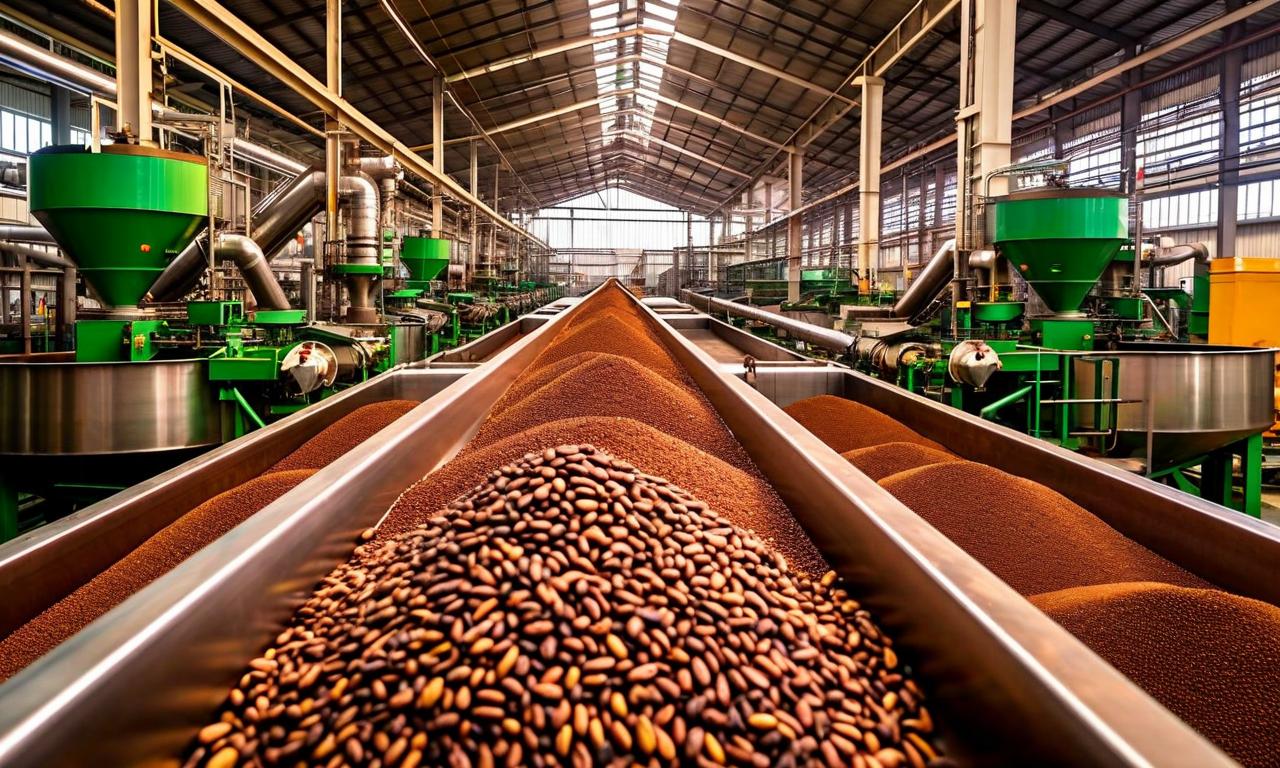

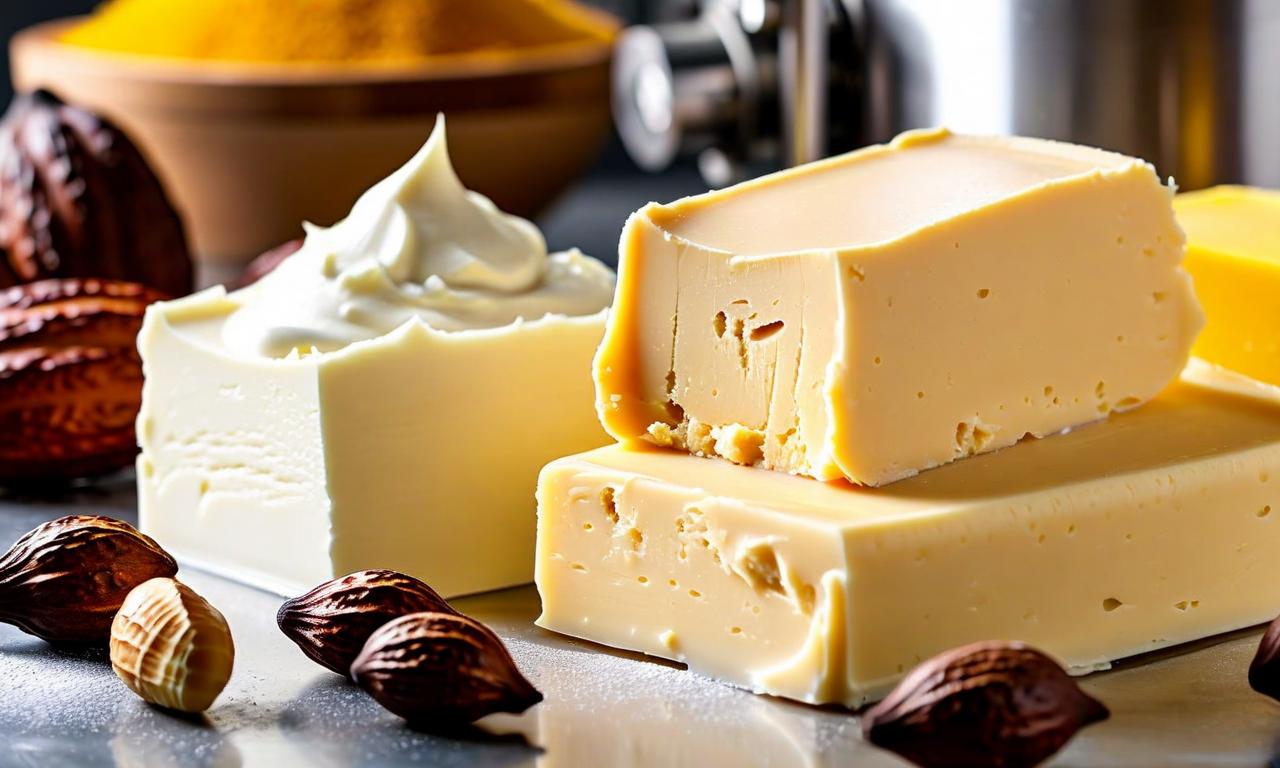
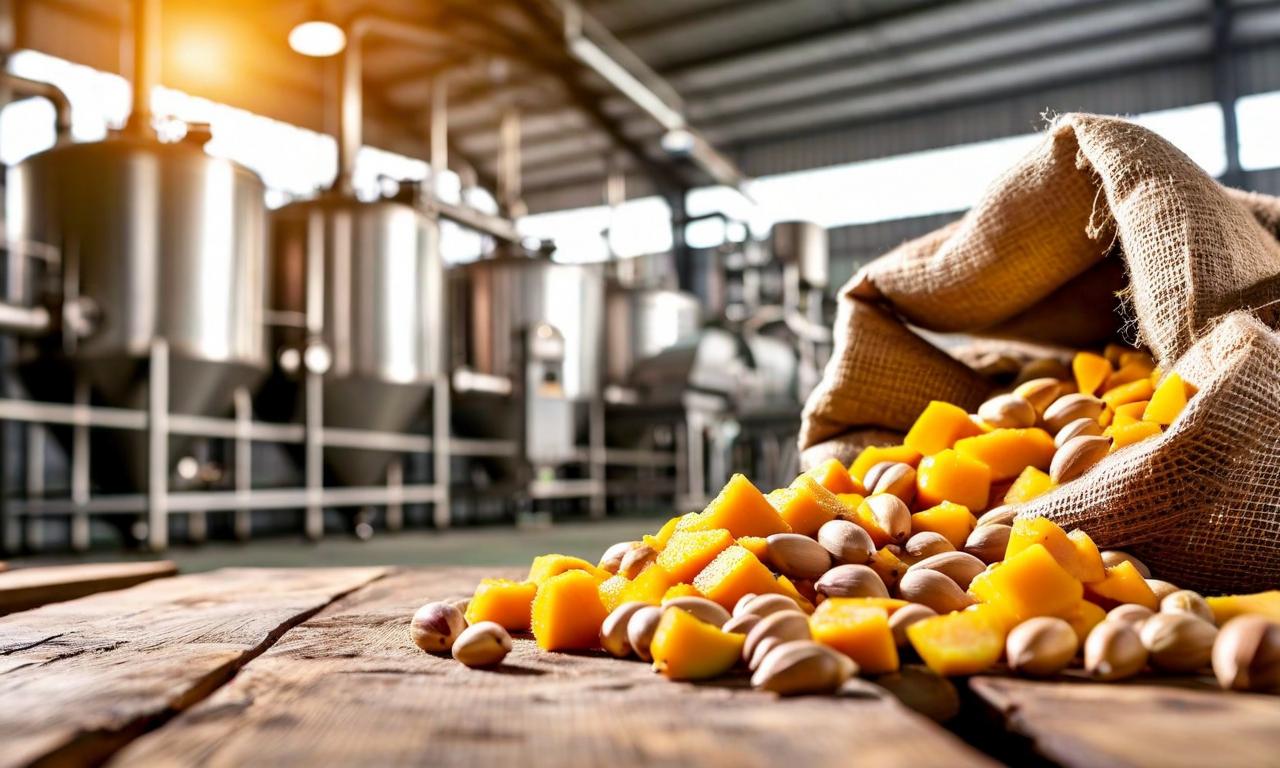
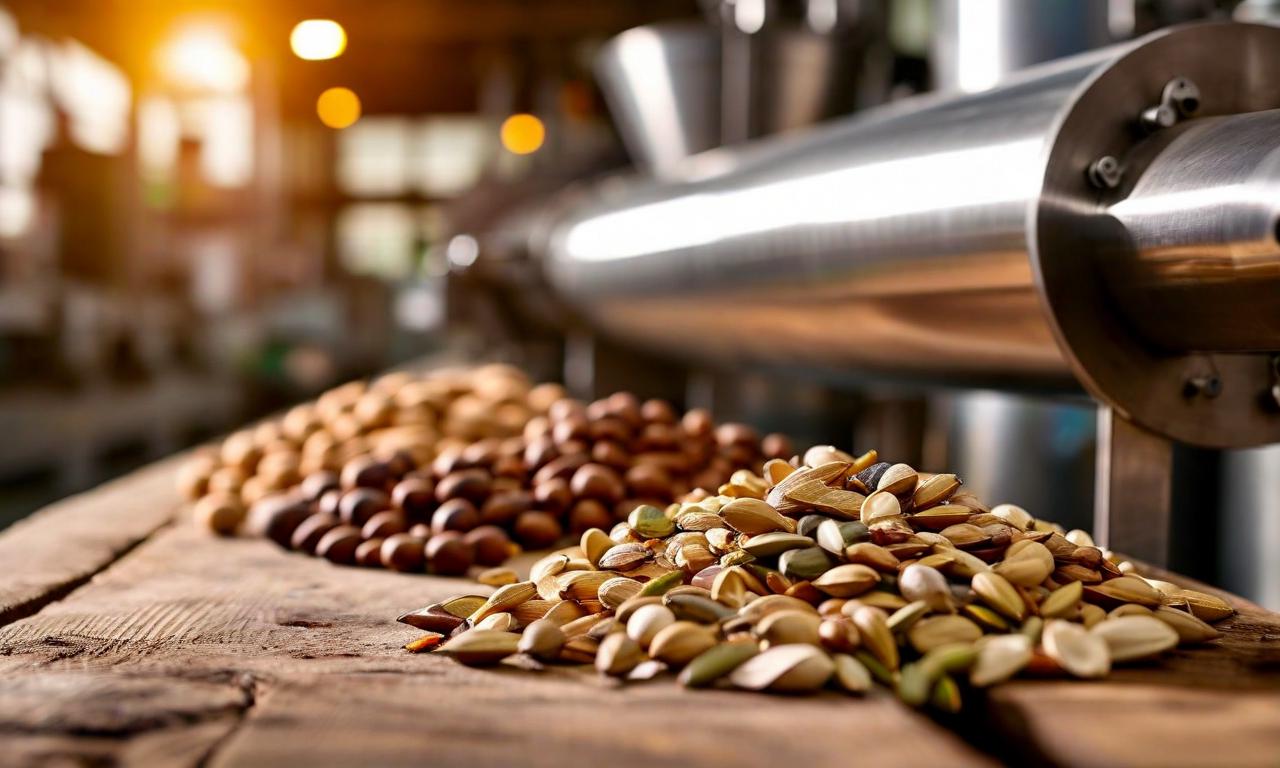
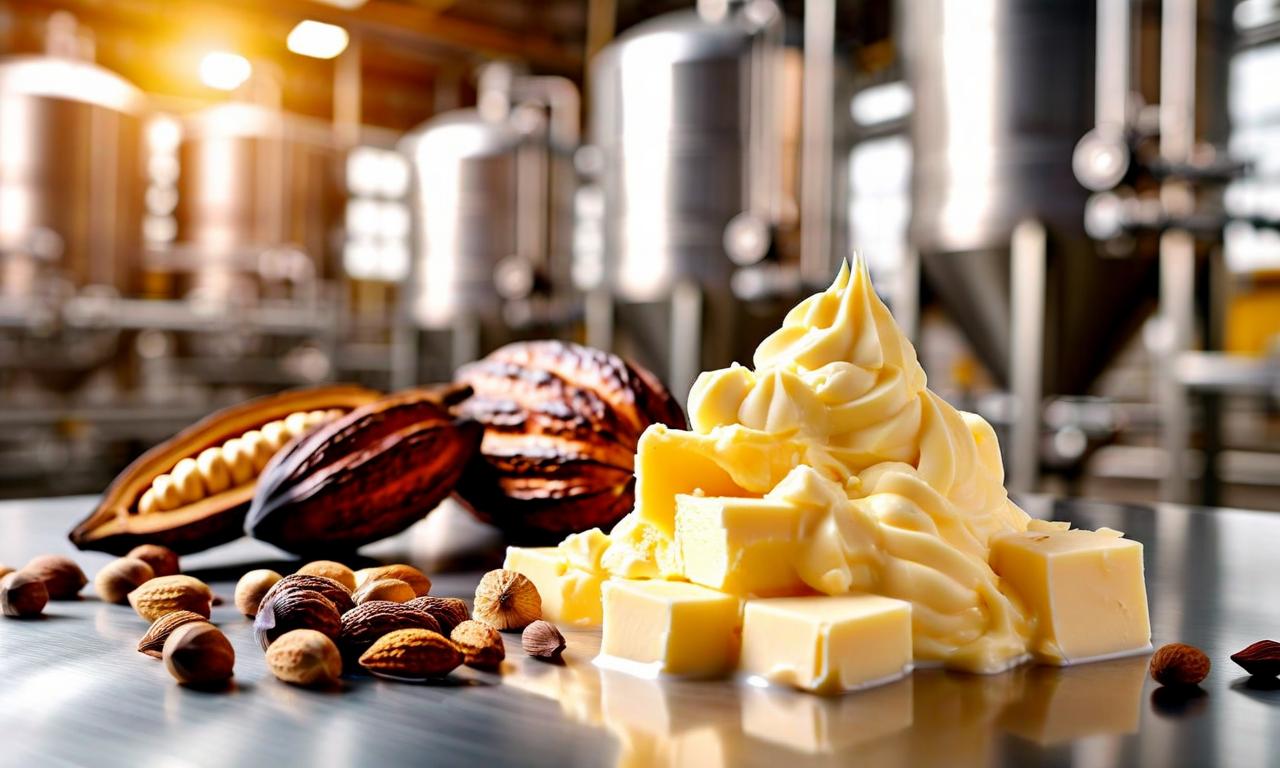
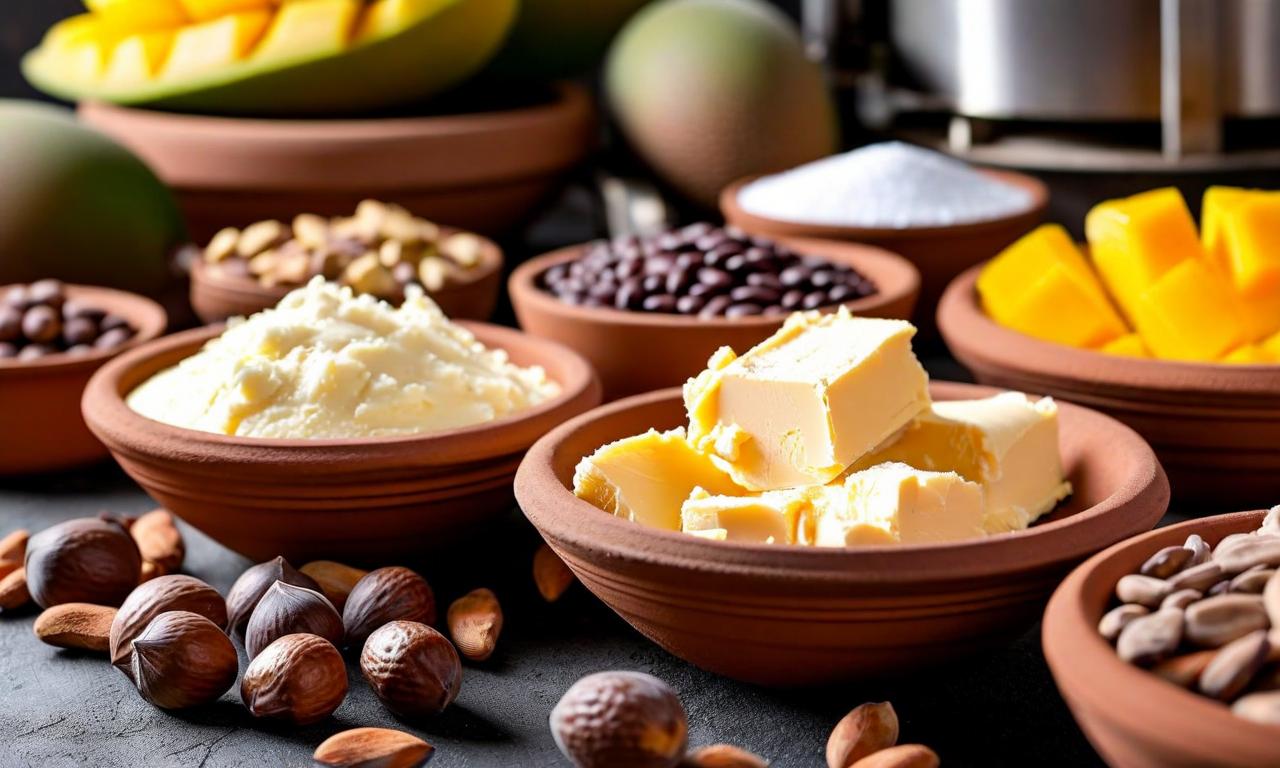
*this image is generated using AI for illustrative purposes only.
Manorama Industries Limited , a leading provider of specialty fats and butters, has reported robust financial results for the first half of FY26, demonstrating strong growth and operational efficiency. The company has also announced ambitious expansion plans and revised its annual guidance upward.
Financial Highlights
For H1 FY26, Manorama Industries reported:
| Metric | Value | YoY Growth |
|---|---|---|
| Consolidated Revenue | 612.90 | 86.4% |
| EBITDA | 156.60 | - |
| EBITDA Margin | 27.2% | - |
| Profit After Tax (PAT) | 105.50 | - |
| PAT Margin | 17.2% | - |
The Q2 FY26 performance was equally impressive:
| Metric | Value |
|---|---|
| Revenue | 323.30 |
| EBITDA | 87.70 |
| EBITDA Margin | 27.1% |
| PAT | 54.90 |
| PAT Margin | 17.0% |
Revised Guidance and Operational Performance
Based on the strong performance, Manorama Industries has revised its annual guidance upward from INR 1,050 crores to INR 1,150 crores plus for FY26. The company reported that value-added products contributed 70%-75% to sales, with plant utilization at 80%-85% of its current 40,000 tons capacity.
Export sales accounted for 58% of revenue, while domestic sales contributed 42%. The company's working capital days have significantly improved from 151 to 97 days, with a target of reaching 75 days over the next two years.
Expansion Plans and Strategic Initiatives
Manorama Industries announced several key initiatives to drive future growth:
Capacity Expansion: The company plans to increase its capacity from 40,000 to 52,000 metric tons annually through plant upgradation in Q3.
Capital Expenditure: Management has announced INR 450 crores in capital expenditure for expansion projects, including:
- Backward integration facilities in West Africa
- Forward integration in Latin America
Global Footprint: The company has established subsidiaries in West Africa to streamline raw material procurement and signed an MoU with the government of Burkina Faso for setting up a processing facility.
Latin America Expansion: Manorama has entered into an agreement with DEKEL in Brazil to utilize their processing facilities for manufacturing specialty fats for the regional market.
Domestic Investment: The company has signed an MoU with the Government of Chhattisgarh for potential investment in future plant expansion projects.
Customer Base and Market Position
Manorama Industries' top customers include global giants such as Mondelez, Nestle, and Hershey's, with the top 10 customers contributing around 40% of revenue. The company maintains its position as a leading supplier of specialty fats and butters globally, particularly in Sal and Mango-based products.
Future Outlook
With its strategic expansion plans, focus on value-added products, and strong customer relationships, Manorama Industries is well-positioned for sustained growth. The company's emphasis on backward and forward integration is expected to improve operational efficiency and strengthen its market position in the specialty fats and butters industry.
As global demand for cocoa butter equivalents and specialty fats continues to grow, Manorama Industries' expansion initiatives and focus on innovation are likely to drive its future performance and market share.
Historical Stock Returns for Manorama Industries
| 1 Day | 5 Days | 1 Month | 6 Months | 1 Year | 5 Years |
|---|---|---|---|---|---|
| +1.78% | +3.00% | -1.35% | +19.57% | +7.31% | +695.93% |
 17
17