Hitachi Energy India Reports Stellar Q2 Results with 405% PAT Growth


Hitachi Energy India Limited (HEIL) has reported outstanding Q2 financial results, with revenue increasing by 23.30% to ₹1,915.20 crore and Profit After Tax (PAT) surging by 405.60% to ₹264.40 crore year-on-year. The company's operational EBITDA grew by 130.50% to ₹291.60 crore, while orders rose by 13.60% to ₹2,217.10 crore. HEIL's order backlog stood at ₹29,412.60 crore, providing strong revenue visibility. Exports contributed 30.40% of total orders, with significant growth in service orders. The company's performance reflects its strong market position in the power grid sector and aligns well with India's focus on renewable energy integration and grid modernization.

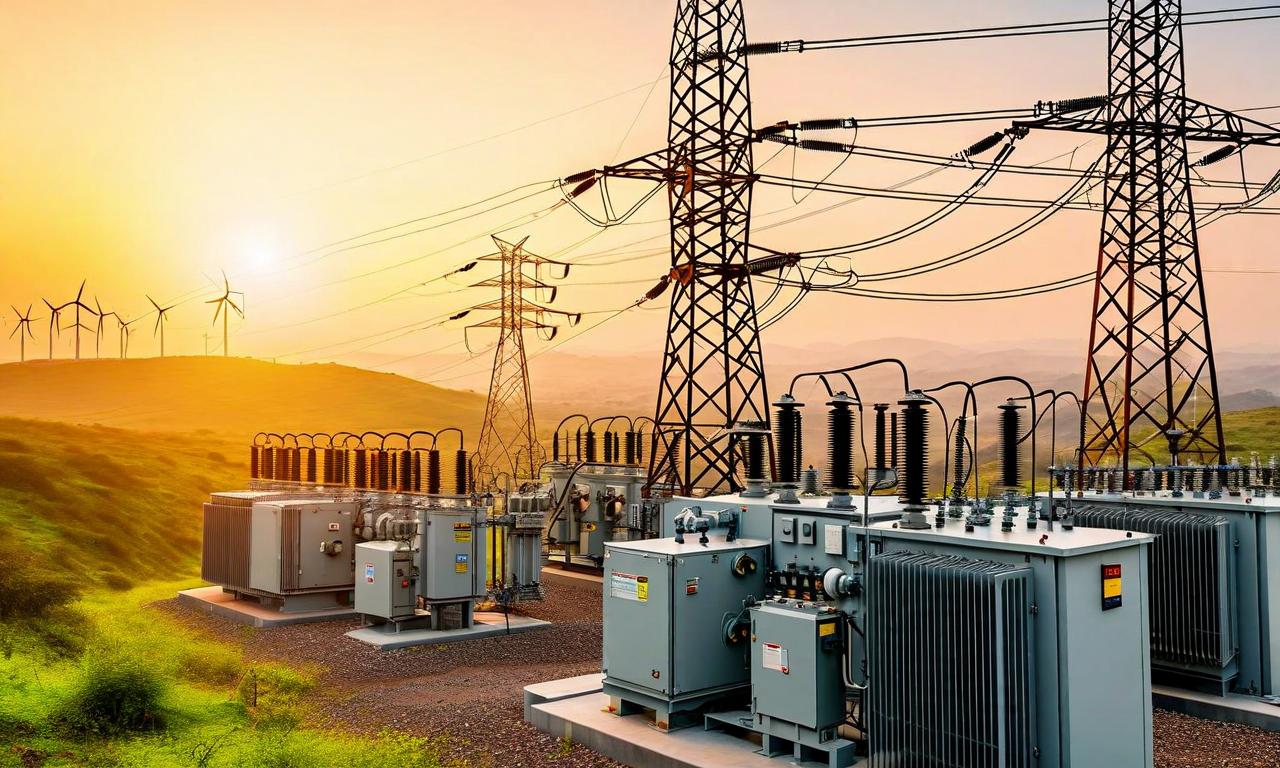
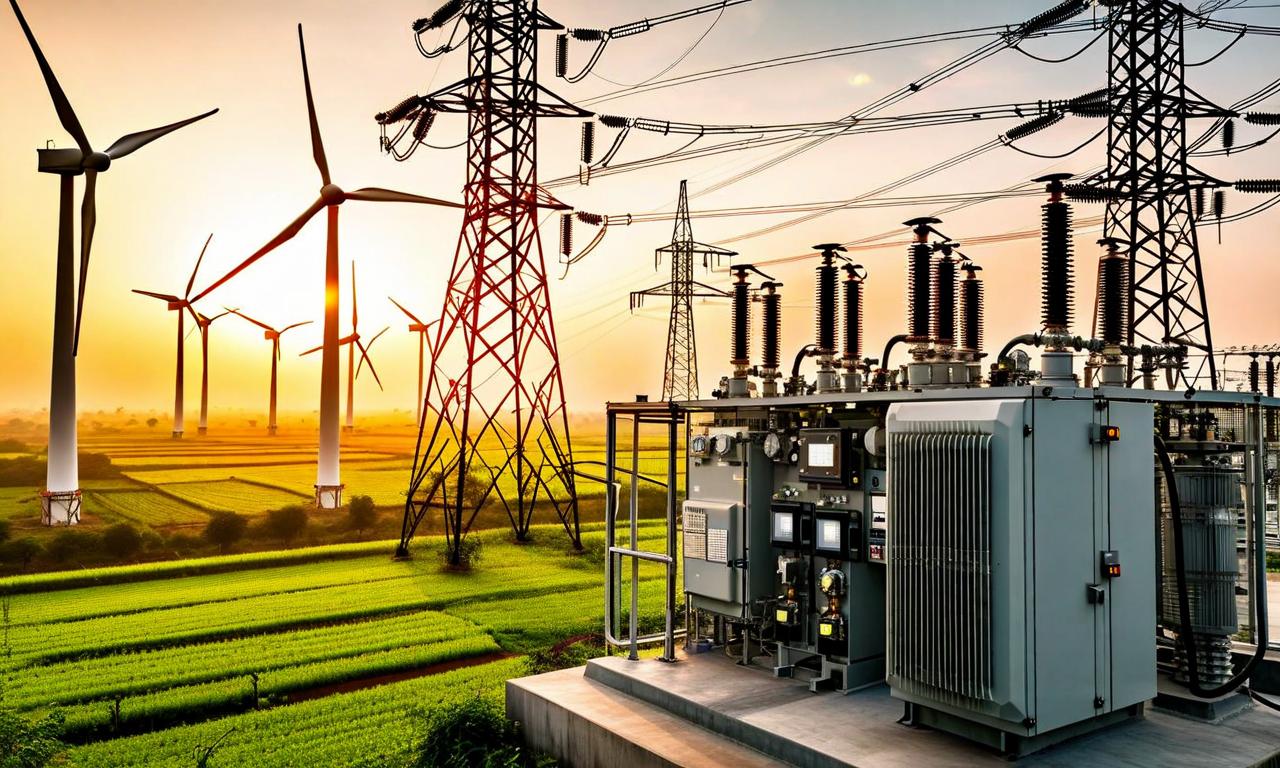
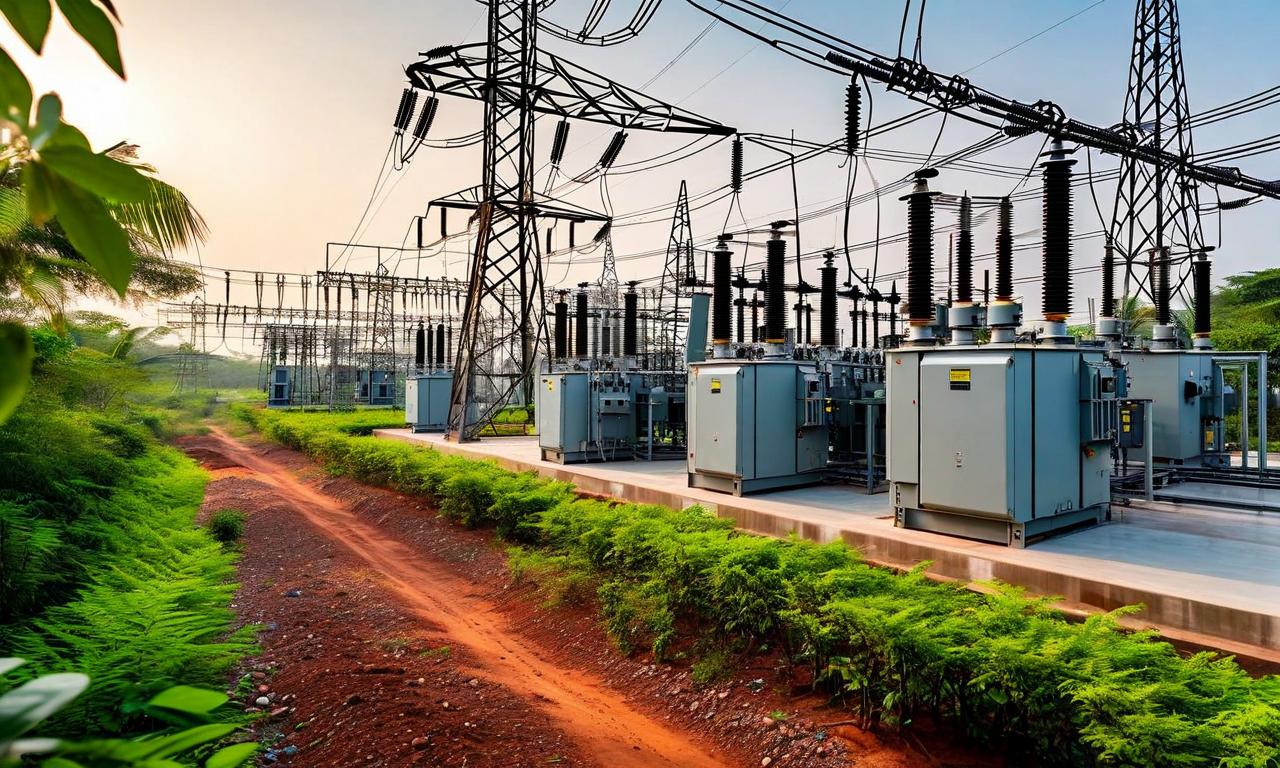
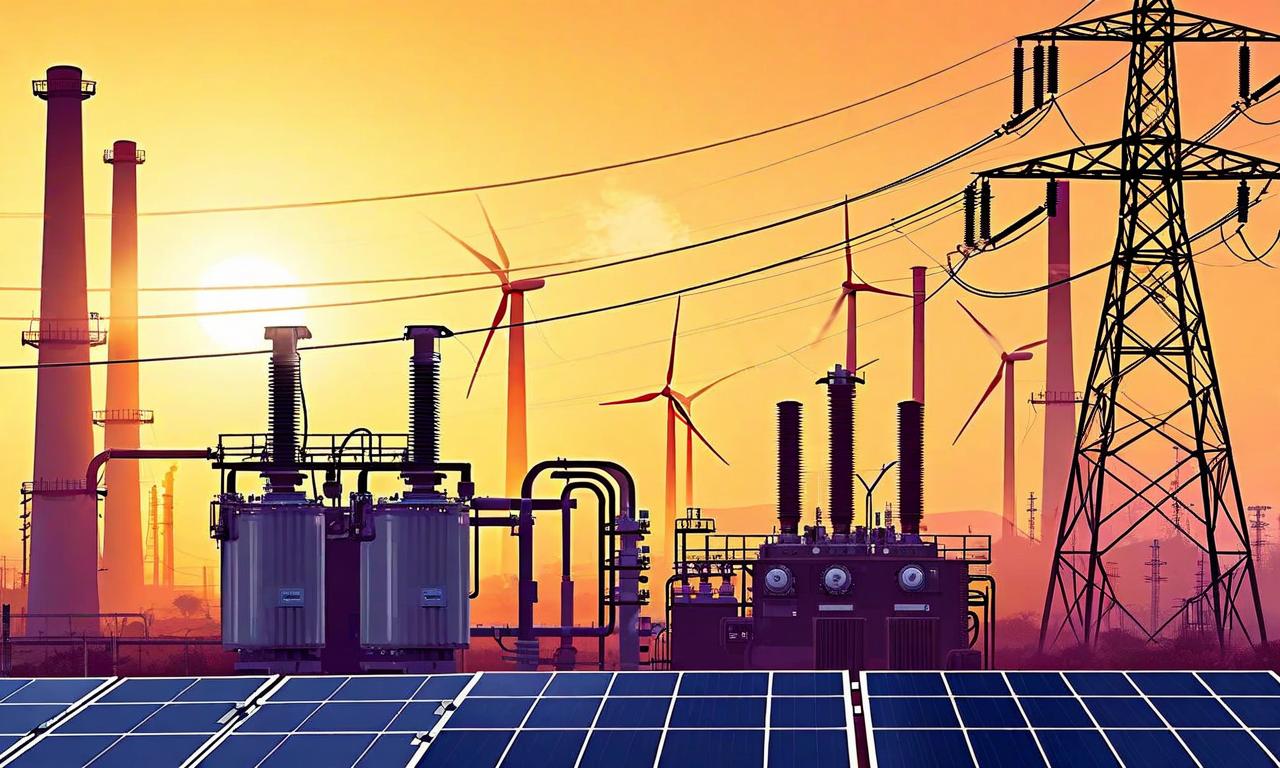
*this image is generated using AI for illustrative purposes only.
Hitachi Energy India Limited (HEIL) has reported exceptional financial results for the second quarter, showcasing robust growth across key metrics. The company's performance underscores its strong market position and operational efficiency in the power grid sector.
Financial Highlights
HEIL's Q2 results demonstrate significant year-on-year improvements:
| Metric | Q2 Current Year | Q2 Previous Year | YoY Growth |
|---|---|---|---|
| Revenue | ₹1,915.20 crore | ₹1,553.80 crore | 23.30% |
| Profit After Tax (PAT) | ₹264.40 crore | ₹52.30 crore | 405.60% |
| PAT Margin | 13.80% | 3.40% | 10.40 percentage points |
| Operational EBITDA | ₹291.60 crore | ₹126.30 crore | 130.50% |
| Op EBITDA Margin | 15.20% | 8.10% | 7.10 percentage points |
Order Book and Market Position
- Orders in Q2 totaled ₹2,217.10 crore, up 13.60% year-on-year.
- The order backlog stood at ₹29,412.60 crore as of September 30, providing strong revenue visibility for upcoming quarters.
- Exports contributed 30.40% of total orders, with significant orders from Europe, Southeast Asia, the Middle East, and North America.
- Service orders grew by 35% year-on-year, indicating strong aftermarket performance.
Operational and Strategic Insights
N Venu, Managing Director & CEO of Hitachi Energy India Ltd., commented on the results: "The country has successfully built-up its non-fossil fuel energy installed base, to 50 percent of its electricity generation capacity. This notable milestone brings with it the challenges of seamlessly integrating intermittent, distributed energy into the national grid. It is essential that we enhance the resilience, reliability, and intelligence of the whole energy ecosystem to effectively deploy the expanding capacity."
The company's focus on advanced grid technologies, digitalization, and integrated solutions appears to be paying off, as reflected in its financial performance. Key factors contributing to the strong results include:
- Effective execution of high-margin orders
- Sustained operational excellence
- Favorable product mix
- Increased export momentum
Market Outlook
Despite global economic uncertainties, India's power sector continues to show promise. The renewable energy sector in India attracted investments of nearly ₹1 lakh crore in the first half of the year, according to the BloombergNEF 2H Renewable Energy Investment Tracker Report. This trend bodes well for companies like Hitachi Energy India, which are positioned to support the integration of renewable energy into the national grid.
The government's shift in focus from capacity expansion to capacity absorption, emphasizing grid integration, energy storage, and market reforms, aligns well with HEIL's core competencies.
Conclusion
Hitachi Energy India's Q2 results demonstrate the company's ability to capitalize on India's evolving energy landscape. With a strong order book, improving margins, and strategic focus on advanced grid solutions, HEIL appears well-positioned to benefit from the ongoing transformation of India's power sector. Investors may find the company's growth trajectory and market positioning attractive, particularly in the context of India's push towards sustainable energy solutions.
Historical Stock Returns for Hitachi Energy
| 1 Day | 5 Days | 1 Month | 6 Months | 1 Year | 5 Years |
|---|---|---|---|---|---|
| +0.05% | -0.89% | -12.40% | +92.94% | +67.19% | +1,571.56% |
 17
17