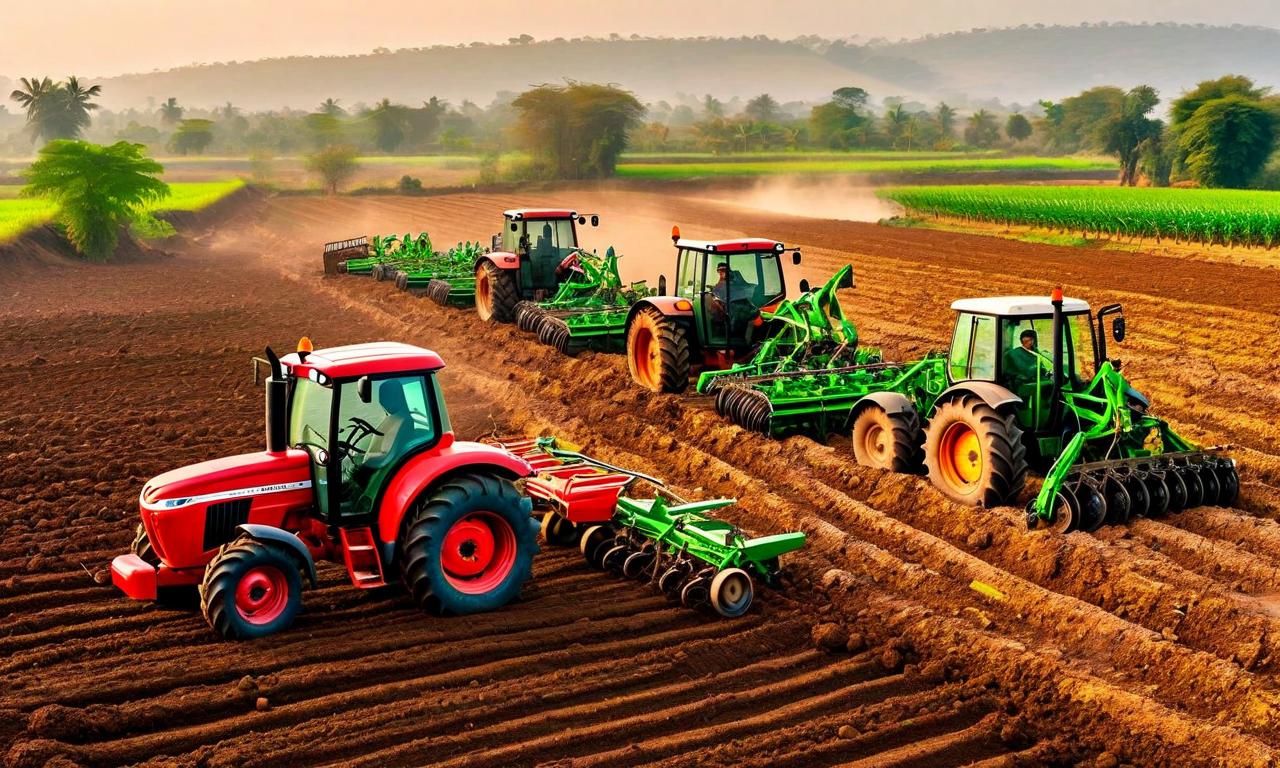
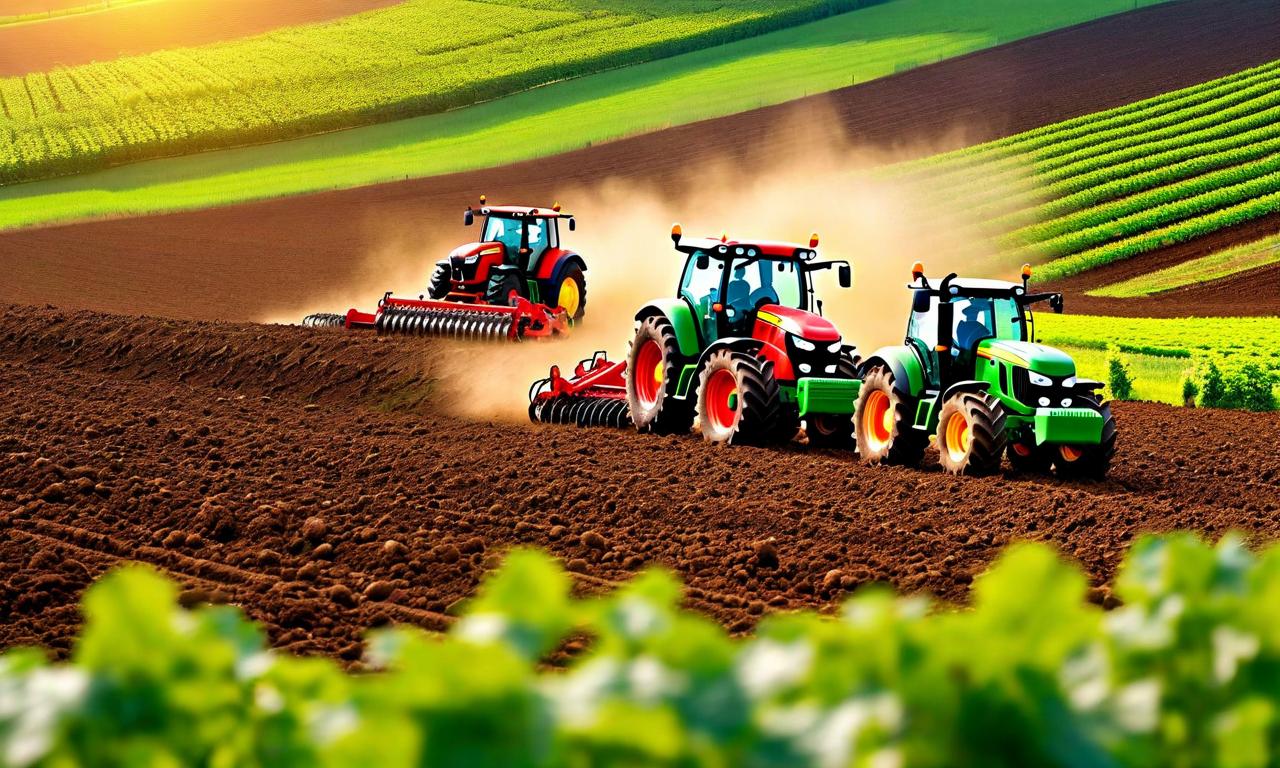
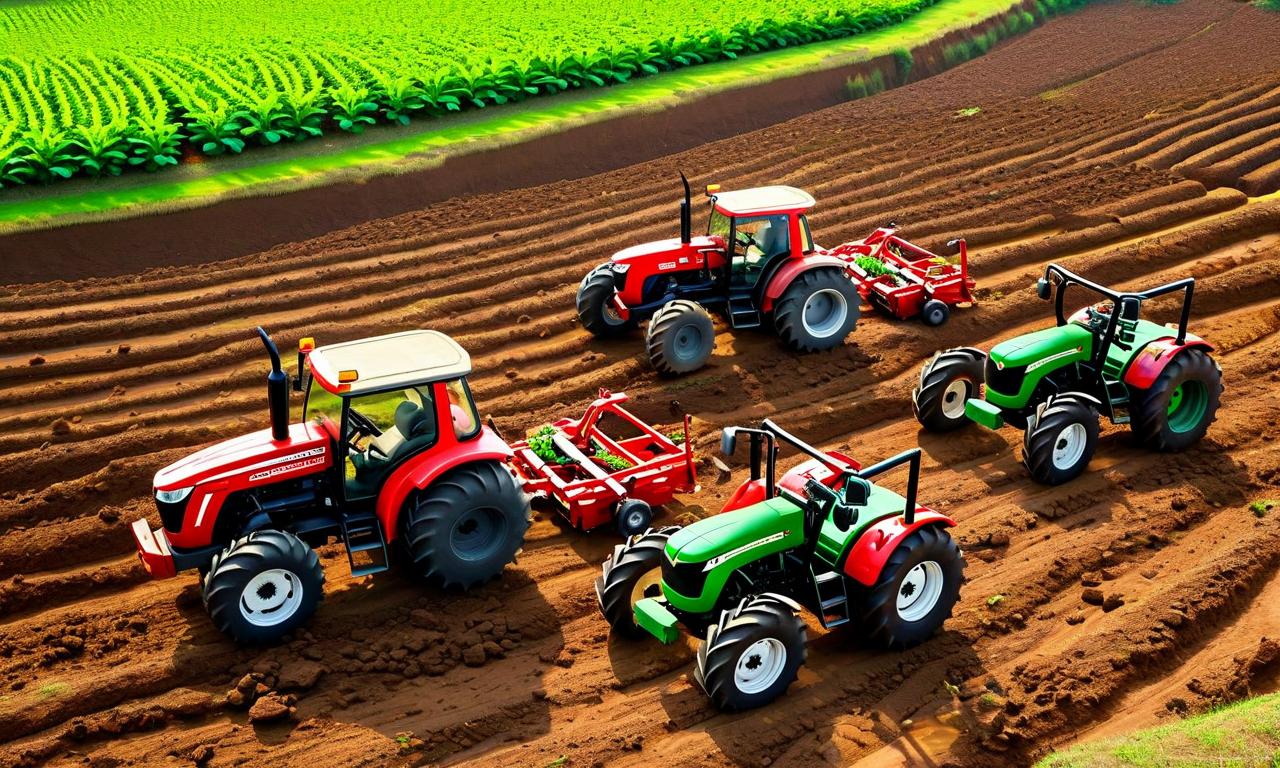
VST Tillers Tractors Reports March 2026 Sales with Tractor Segment Growth


VST Tillers Tractors disclosed March 2026 sales showing contrasting performance across segments. Total sales declined to 4940 units from 7892 units year-over-year, driven by power tiller segment decline to 4185 units from 7221 units. However, the tractors segment demonstrated growth with 755 units versus 671 units in March 2025, highlighting positive momentum in this category despite overall monthly performance.

*this image is generated using AI for illustrative purposes only.
VST Tillers Tractors Ltd. has disclosed its sales quantity figures for March 2026, revealing mixed performance across its product portfolio. The company reported total sales of 4940 units during March 2026, representing a decline from 7892 units sold in March 2025. Notably, the tractors segment demonstrated positive growth with 755 units sold compared to 671 units in the corresponding month of the previous year.
March 2026 Sales Performance
The monthly sales data shows contrasting trends between the company's two main product categories. Power tillers, which constitute the larger segment, recorded 4185 units sold in March 2026 compared to 7221 units in March 2025. The tractors segment was the bright spot, showing year-over-year growth with 755 units sold in March 2026 against 671 units in the corresponding month of the previous year.
| Product Category: | March 2026 | March 2025 | Change |
|---|---|---|---|
| Power Tillers: | 4185 units | 7221 units | Decline |
| Tractors: | 755 units | 671 units | Growth |
| Total Sales: | 4940 units | 7892 units | Decline |
Year-to-Date Performance Analysis
The year-to-date figures present a more positive outlook for VST Tillers Tractors. Total cumulative sales reached 56243 units for the period ended March 2026, compared to 42584 units in the corresponding period of the previous year. This represents significant growth in the overall annual performance despite the monthly decline.
| Metric: | FY 2025-26 YTD | FY 2024-25 YTD | Performance |
|---|---|---|---|
| Power Tillers: | 50332 units | 37297 units | Strong Growth |
| Tractors: | 5911 units | 5287 units | Moderate Growth |
| Total YTD Sales: | 56243 units | 42584 units | Positive Growth |
Tractor Segment Highlights
The tractors segment's performance stands out as a key positive development for the company. With 755 units sold in March 2026 versus 671 units in March 2025, the segment achieved year-over-year growth despite overall monthly sales declining. This growth trajectory is consistent with the segment's year-to-date performance, which shows 5911 units compared to 5287 units in the previous year.
Product Portfolio Analysis
The power tillers segment continues to dominate the company's sales volume, accounting for the majority of both monthly and year-to-date sales. While March 2026 showed a decline in power tiller sales, the year-to-date performance of 50332 units compared to 37297 units in the previous year indicates robust annual demand.
Regulatory Disclosure
The sales data was communicated to both the National Stock Exchange of India Limited and BSE Limited as part of the company's regular disclosure obligations. VST Tillers Tractors has noted that the reported figures are unaudited and may vary when audited figures are finalized. The disclosure was signed by Company Secretary Chinmaya Khatua and submitted on April 01, 2026.
Historical Stock Returns for VST Tillers Tractors
| 1 Day | 5 Days | 1 Month | 6 Months | 1 Year | 5 Years |
|---|---|---|---|---|---|
| -0.79% | -2.73% | -2.48% | -17.25% | +0.27% | +117.42% |
What factors could drive VST Tillers to sustain the positive momentum in tractor sales while addressing the decline in power tiller demand?
How might the company's product mix strategy evolve given the contrasting performance between tractors and power tillers?
What market conditions or seasonal factors could explain the sharp monthly decline despite strong year-to-date performance?
 20
20