

Solar Industries sets ₹14,000 crore FY27 guidance after record Q1


Solar Industries India Limited delivered record Q1FY27 results with revenue up 70% to ₹3,668 crore and PAT up 89% to ₹666 crore. The defence segment grew 123% YoY, while international explosives rose 65%. The company provided FY27 revenue guidance of ₹14,000 crore, backed by a ₹21,350 crore order book and ₹2,050 crore planned capex.


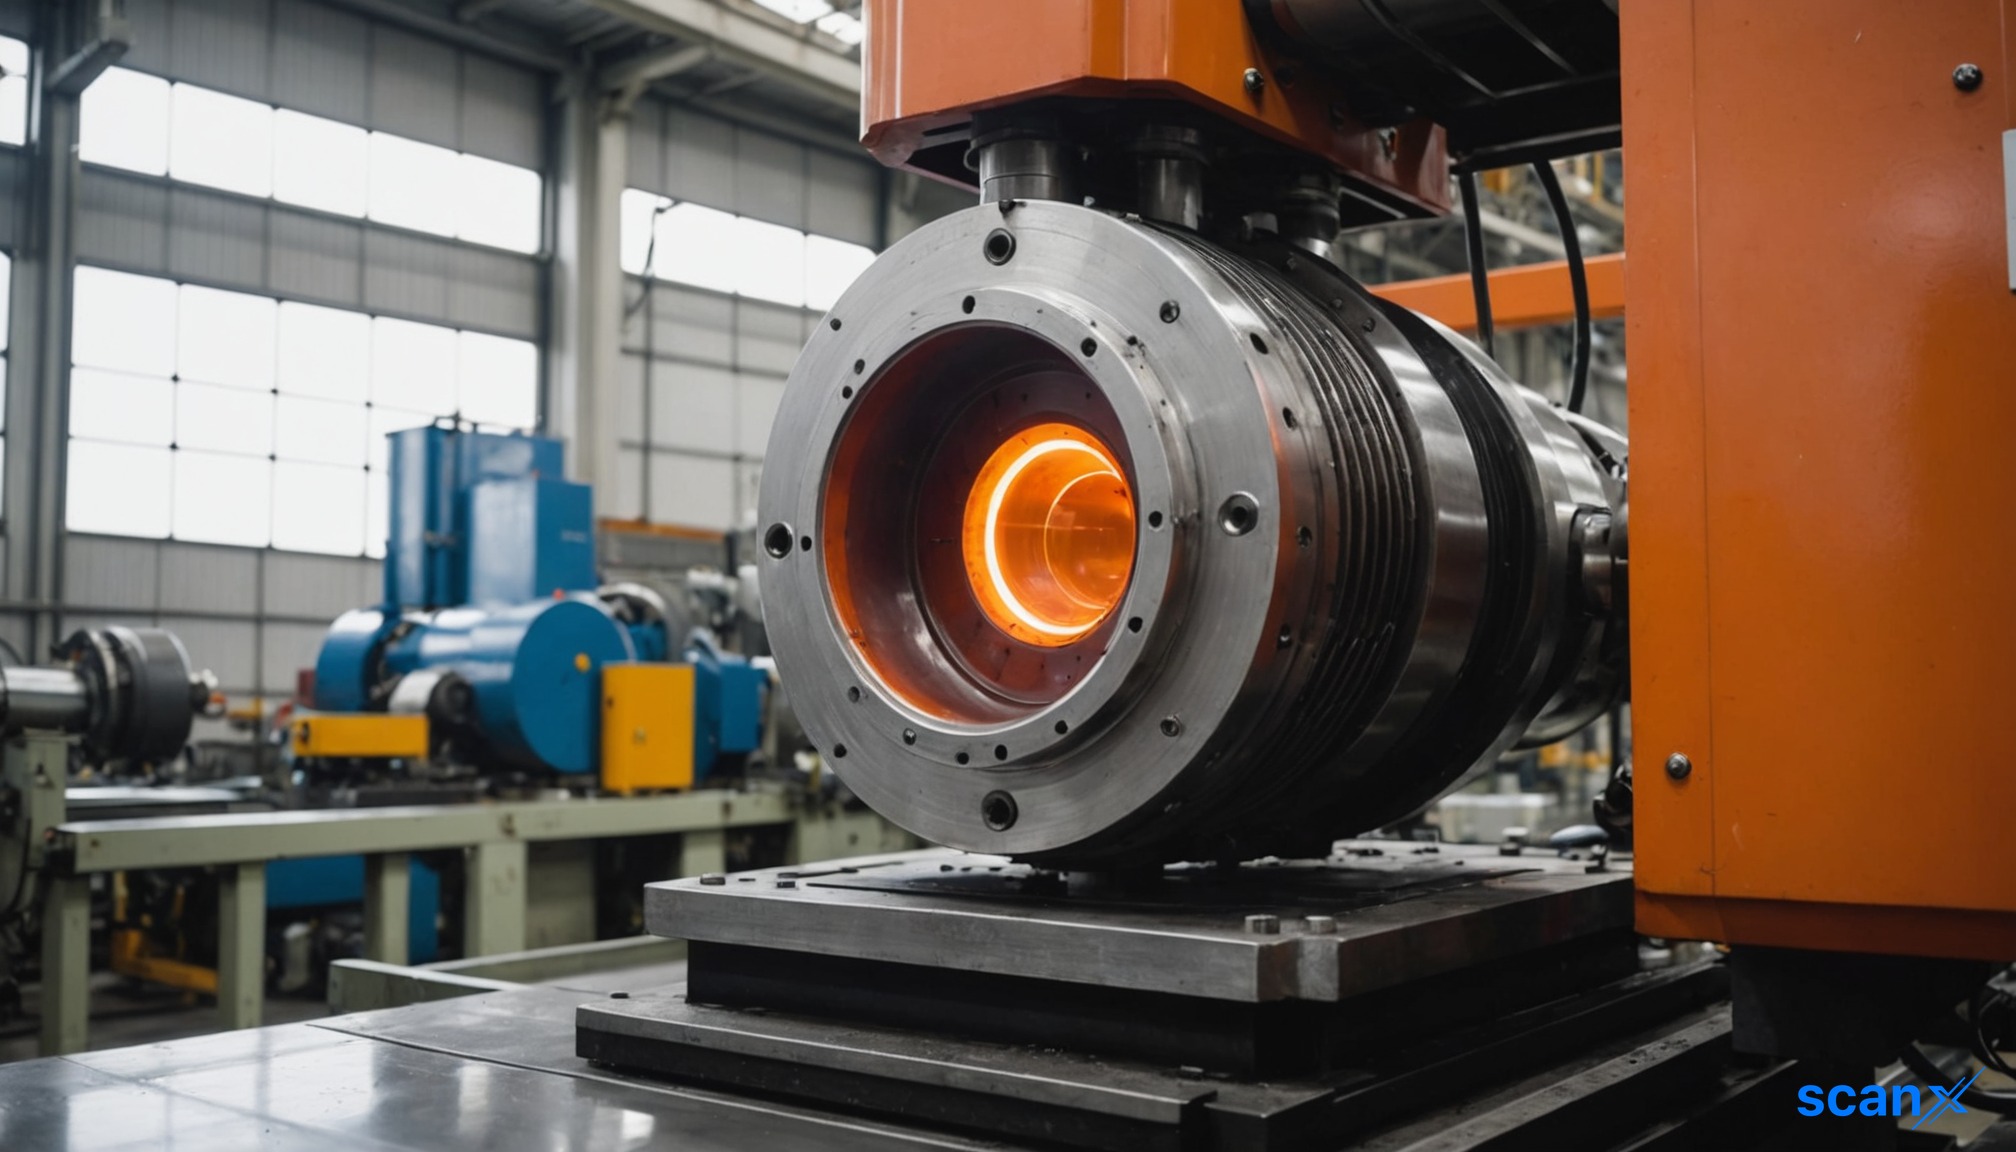
*this image is generated using AI for illustrative purposes only.
Solar Industries reported a significant acceleration in profitability for the first quarter of FY27, achieving its highest-ever quarterly revenue, EBITDA, PBT, and PAT. Driven by robust demand across its explosives and defence segments, the company’s net sales rose 70% year-on-year to ₹3,668 crore, while net profit after tax (PAT) surged 89% to ₹666 crore. This performance reflects strong operational leverage, with EBITDA growing at a faster pace than revenue.
The financial results were filed pursuant to Regulation 30 of the SEBI (Listing Obligations & Disclosure Requirements) Regulations, 2015. The unaudited results cover the quarter ended June 30, 2026.
Financial Performance
Revenue growth was accompanied by improved operating efficiency. EBITDA increased 82% to ₹1,024 crore, expanding the EBITDA margin by 173 basis points year-on-year to 27.91%. Profit before tax (PBT) rose 89% to ₹911 crore.
| Metric | Q1FY27 | Q1FY26 | Change |
|---|---|---|---|
| Net Sales | ₹3,668 crore | ₹2,154 crore | +70% |
| EBITDA | ₹1,024 crore | ₹564 crore | +82% |
| PBT | ₹911 crore | ₹481 crore | +89% |
| PAT | ₹666 crore | ₹353 crore | +89% |
Cost management remained effective despite higher input volumes. Material consumed grew 70% in line with revenue, keeping the material cost ratio stable at 50.63% of net sales compared to 50.80% in the prior year. Employee costs rose 39% to ₹256 crore, declining as a percentage of sales from 8.53% to 6.97%, indicating favorable operating leverage.
What the Numbers Show
The divergence between revenue growth and employee cost growth highlights significant operating leverage. While sales jumped 70%, employee costs increased only 39%, reducing their share of net sales by 156 basis points. Similarly, other expenses grew 58%, lower than the revenue growth rate, contributing to the expansion in EBITDA margins. This suggests that the company is scaling operations efficiently without proportional increases in fixed overheads.
Segment-wise Revenue
Revenue from domestic explosives customers grew 52% quarter-on-quarter to ₹1,361 crore, accounting for 37% of total sales. International explosives revenue saw a sharper 65% quarter-on-quarter rise to ₹1,364 crore, also representing 37% of the mix. Defence segment revenue more than doubled year-on-year, rising 123% to ₹933 crore, though it constituted a smaller share (26%) of total sales compared to the explosives businesses.
| Customer Segment | Q1FY27 Revenue | % of Sales | QoQ Change |
|---|---|---|---|
| Domestic Explosives | ₹1,361 crore | 37% | +52% |
| International Explosives | ₹1,364 crore | 37% | +65% |
| Defence | ₹933 crore | 26% | +123% |
| Others | ₹10 crore | 0% | -17% |
Guidance and Capital Allocation
Management set an ambitious revenue guidance of ₹14,000 crore for FY27. To support this trajectory, the company outlined a planned capital investment of ₹2,050 crore. Approximately ₹450 crore has already been deployed during the first quarter. Key expansion initiatives include the commissioning of the Dhule plant in Western India, significant expansions at the Dholpur facility in North India, and an upcoming new facility in Orissa.
Order Book and Shareholding
The company maintained a healthy order book of ₹21,350 crore, providing visibility into future revenue streams. Key customers include Coal India and Singareni Collieries Company Limited (SCCL).
As of June 30, 2026, promoters held 73.15% of the equity. Institutional investors held a combined stake of approximately 19%, with Mutual Funds and AIFs holding 12.46% and FIIs/FPIs holding 6.42%.
Historical Stock Returns for Solar Industries
| 1 Day | 5 Days | 1 Month | 6 Months | 1 Year | 5 Years |
|---|---|---|---|---|---|
| -1.51% | -0.92% | -10.87% | +36.77% | +42.14% | +684.46% |

How will the commissioning of the Dhule plant and expansions in Dholpur and Orissa impact Solar Industries' production capacity and market share in the coming quarters?
Given the 123% YoY growth in the defence segment, what specific new contracts or government initiatives are driving this surge, and is this growth sustainable?
With a ₹21,350 crore order book, how does management plan to manage supply chain constraints and raw material volatility to meet the ambitious ₹14,000 crore FY27 revenue target?
 16
16





 Access 50+ Readymade Screeners
  Use 200+ Custom Filters
  Get Full Market Insights





