

Vinati Organics Q1 Results: Net Profit Up 9.5% YoY, EBITDA Margin Contracts to 24.5%


Vinati Organics posted a 9.5% YoY rise in standalone net profit to ₹123.56 crore for Q1FY26, with revenue surging 28.7% to ₹697.75 crore. Consolidated EBITDA stood at 1.71B rupees versus 1.6B rupees YoY, but EBITDA margin contracted sharply to 24.5% from 29.5%, reflecting significant cost pressures from rising raw material and energy expenses despite robust top-line growth.


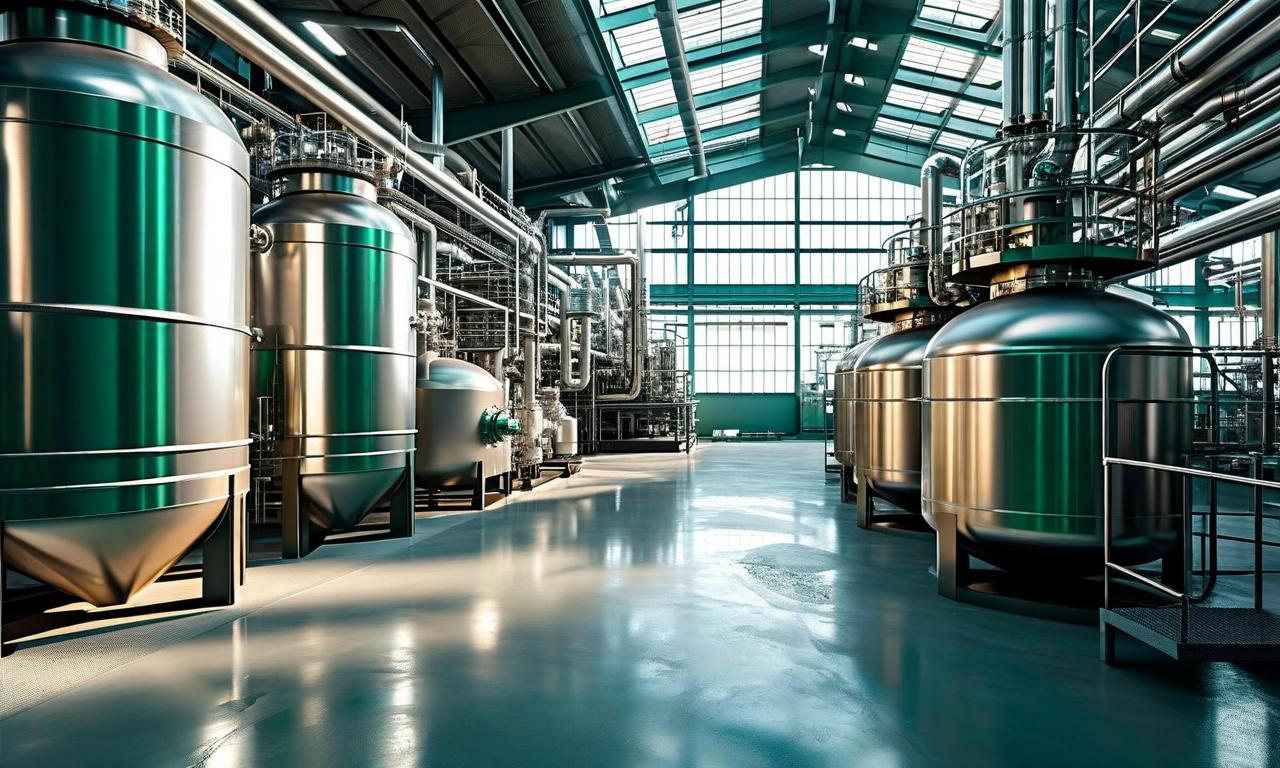
*this image is generated using AI for illustrative purposes only.
Vinati Organics reported a 9.5% year-on-year increase in standalone net profit to ₹123.56 crore for the quarter ended June 30, 2026, driven by a 28.7% surge in revenue from operations to ₹697.75 crore. The chemical manufacturer's consolidated net profit rose to 1.1B rupees from 1.04B rupees in the same period last year, while consolidated revenue grew to 6.96B rupees from 5.4B rupees. However, consolidated EBITDA margin contracted sharply to 24.5% from 29.5% year-on-year, reflecting the pressure of rising input and energy costs on profitability despite strong top-line growth.
The Board of Directors approved the unaudited financial results on July 29, 2026, pursuant to Regulations 30 and 33 of the SEBI (Listing Obligations and Disclosure Requirements) Regulations, 2015. Statutory Auditors M/s. M. M. Nissim & Co. LLP issued limited review reports for both standalone and consolidated figures. The results were prepared in accordance with Ind AS 34 and reviewed by the Audit Committee prior to board approval.
Standalone Financial Performance
Standalone revenue from operations jumped from ₹542.26 crore in Q1FY25 to ₹697.75 crore in Q1FY26. Other income also increased to ₹8.85 crore from ₹7.30 crore in the corresponding previous period. Total expenses rose to ₹541.70 crore from ₹398.09 crore, primarily due to higher costs of materials consumed (₹362.11 crore vs ₹282.29 crore) and power & fuel costs (₹42.47 crore vs ₹33.80 crore). Despite the expense rise, profit before tax improved to ₹164.90 crore from ₹151.47 crore.
| Particulars: | Q1FY26 | Q1FY25 | Change (%) |
|---|---|---|---|
| Revenue from Operations: | ₹697.75 crore | ₹542.26 crore | +28.7% |
| Total Expenses: | ₹541.70 crore | ₹398.09 crore | +36.1% |
| Profit Before Tax: | ₹164.90 crore | ₹151.47 crore | +8.9% |
| Net Profit: | ₹123.56 crore | ₹112.78 crore | +9.5% |
| EPS (Basic): | ₹11.92 | ₹10.88 | +9.6% |
Consolidated Financial Highlights
On a consolidated basis, revenue from operations stood at 6.96B rupees, up from 5.4B rupees in the same quarter last year. Consolidated EBITDA came in at 1.71B rupees compared to 1.6B rupees in the prior year period, though the EBITDA margin narrowed significantly to 24.5% from 29.5%, indicating that cost escalation outpaced revenue gains at the operating level. Cost of materials consumed was ₹380.62 crore, compared to ₹281.48 crore previously, while employee benefits expenses increased to ₹50.46 crore from ₹42.37 crore. The group's profit before tax reached ₹147.76 crore, up from ₹141.16 crore, with basic earnings per share rising to ₹10.50 from ₹10.05.
| Particulars: | Q1FY26 | Q1FY25 | Change |
|---|---|---|---|
| Revenue: | 6.96B rupees | 5.4B rupees | YoY Growth |
| EBITDA: | 1.71B rupees | 1.6B rupees | YoY Growth |
| EBITDA Margin: | 24.5% | 29.5% | -500 bps |
| Net Profit: | 1.1B rupees | 1.04B rupees | YoY Growth |
| EPS (Basic): | ₹10.50 | ₹10.05 | +4.5% |
What the Numbers Show
The divergence between revenue growth and profit growth underscores margin compression pressure, primarily stemming from rising raw material and energy costs. The 500 basis point contraction in consolidated EBITDA margin to 24.5% from 29.5% year-on-year highlights that while the company achieved strong top-line expansion, cost escalation — particularly in materials consumed — weighed on operating profitability. The foreign subsidiary, Vinati Organics USA Inc., contributed ₹5.96 crore in revenue and ₹0.91 crore in net profit, which management deemed immaterial to the group's overall results. The company operates in a single primary segment under Ind AS 108: Manufacturing of Chemicals, and no exceptional items were recorded during the period.
Historical Stock Returns for Vinati Organics
| 1 Day | 5 Days | 1 Month | 6 Months | 1 Year | 5 Years |
|---|---|---|---|---|---|
| +3.41% | -1.20% | -8.84% | -8.77% | -30.41% | -37.66% |

What specific hedging strategies or supply chain adjustments is Vinati Organics implementing to mitigate the impact of rising raw material and energy costs in upcoming quarters?
How does the 500 basis point contraction in EBITDA margins compare to peer chemical manufacturers, and is this margin compression expected to persist through FY26?
Given the strong top-line growth driven by volume, will management prioritize volume expansion over price realization to maintain market share despite input cost pressures?
 19
19







 Create Custom Screeners
  Access 200+ Pre-built Filters
  Use 50+ Readymade Screener





