

Uber Technologies Q2FY26 Results: Gross bookings up 22% to $58B, EPS rises 35%


- Gross Bookings grew 22% YoY to over $58 billion, exceeding guidance
- Non-GAAP EPS rose 35% YoY, driven by operating leverage
- Trailing 12-month free cash flow exceeded $10 billion for the first time
- Uber plans to launch AV services in 15 cities by year-end
- Acquisition of Delivery Guru expands reach to nearly 100 markets

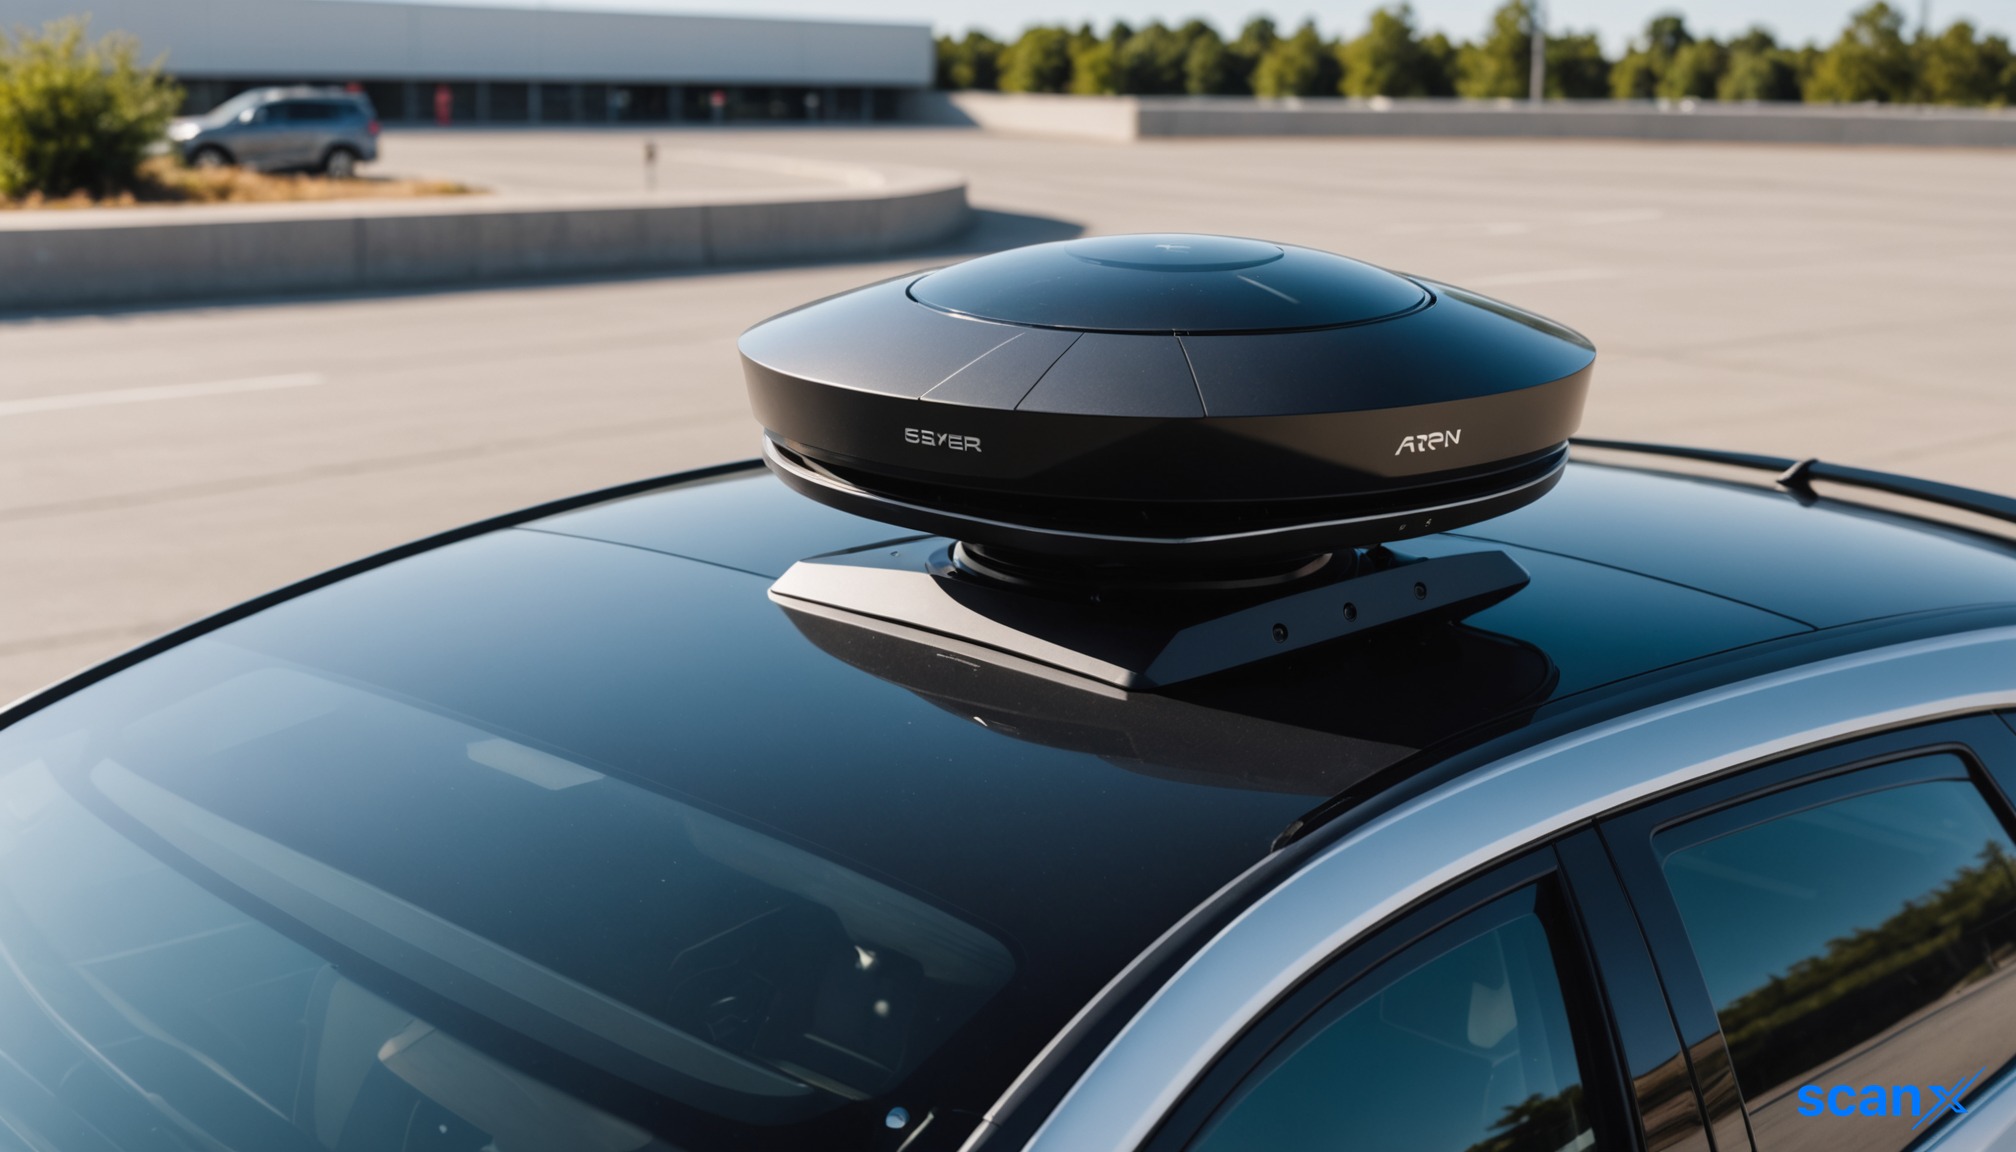

*this image is generated using AI for illustrative purposes only.
Uber Technologies reported strong second-quarter fiscal 2026 results, with Gross Bookings growing 22% year-over-year to more than $58 billion. This performance exceeded the high end of guidance and marked the fourth consecutive quarter of growth above 20%. The company also achieved record cash generation, with trailing 12-month free cash flow exceeding $10 billion for the first time in its history.
Non-GAAP earnings per share (EPS) increased 35% year-over-year, reflecting significant operating leverage. CEO Dara Khosrowshahi highlighted that record audience engagement drove durable growth and expanding margins. The company announced an agreement to acquire Delivery Guru, a move expected to expand its reach to nearly 100 markets and double the number of locations offering both Mobility and Delivery services.
Autonomous Vehicle Strategy and Investments
Uber continues to position itself as the leading commercialization platform for autonomous vehicles (AVs). Khosrowshahi noted that the industry structure is clarifying, with multiple frontier models emerging rather than a single dominant foundation model. Uber is live in seven cities with AV partners and is on track to operate in 15 cities by year-end. Upcoming launches include Nuro in the Bay Area, Zoox in Las Vegas, and Wayve in London and Tokyo.
The company is investing approximately $10 billion over a multiyear period into the AV ecosystem. CFO Balaji Krishnamurthy explained that this investment includes equity stakes in software partners and balance sheet support for infrastructure. For every dollar Uber invests, partners have raised an additional $2.50 from other investors. AV trips currently account for less than 0.5% of overall trip volume, but utilization rates on Uber’s platform are high, often reaching mid-to-high 20s or low 30s trips per vehicle per day.
Mobility Growth Drivers and Market Dynamics
In the US, Mobility trips and Gross Bookings accelerated, driven by three key factors: insurance savings reinvested into the market, product innovation velocity, and expansion in sparse markets. Less than 10% of eligible consumers in sparse markets have used Uber in the past 12 months, compared to over 50% in dense markets, indicating significant room for growth.
First-time user momentum reached record levels, supported by lower-cost products like Wait & Save and cross-platform usage. Only 20% of consumers currently use both Rides and Eats, yet these users grow 1.5x faster than single-product users. In Brazil, competitive intensity increased due to DiDi Food and Meituan entering the delivery space, impacting two-wheeler supply costs. However, Uber maintained its market share, shifting incentives from consumers to delivery partners.
Operational Efficiency and AI Integration
Uber is leveraging artificial intelligence to moderate headcount additions and improve productivity. Engineers have seen near 100% adoption of AI-based coding tools, resulting in a doubling of code output per engineer. Surgical headcount reductions of 10-20% were implemented in specific organizations during the quarter. These efficiencies allow Uber to reinvest savings into marketplace growth while maintaining discipline.
AI is also enhancing consumer experiences, with features like Cart Builder increasing average order sizes by 2x. Personalized destination suggestions drive 75% of rides, reducing friction and improving conversion rates. On the capital allocation front, Uber deployed about $4 billion toward M&A in Q2, primarily for Delivery Hero stock purchases. The company plans to rebuild share repurchase levels in the coming months, targeting 50% of free cash flow for buybacks historically.
What the Numbers Show
A divergence exists between reported revenue take rates and net take rates. While mobility revenue margins declined nearly 500 bps YoY, approximately 400 bps of this decline was optical, resulting from a UK business model change that moved costs from contra cost of revenue. Excluding this, net take rates remained broadly stable. Furthermore, despite the optical decline in take rates, mobility operating income margin remained strong at 7.6%, indicating that underlying profitability was not eroded by the accounting shift.
| Metric | Q2FY26 Performance | Context |
|---|---|---|
| Gross Bookings | >$58 billion | +22% YoY |
| Non-GAAP EPS | +35% YoY | Record growth |
| Free Cash Flow | >$10 billion | Trailing 12 months |
| AV Cities Live | 7 cities | Targeting 15 by year-end |
| US Sparse Market Penetration | <10% | vs >50% in dense markets |

How will the $10 billion multiyear investment in the autonomous vehicle ecosystem impact Uber's free cash flow trajectory over the next 24 months?
What are the potential regulatory and safety hurdles facing Uber's expansion from seven to fifteen AV cities by year-end, particularly with new partners like Wayve in London?
Can Uber sustain its high utilization rates for AVs as it scales into sparse markets, or will lower demand density erode the current economic model?








 Create Custom Screeners
  Access 200+ Pre-built Filters
  Use 50+ Readymade Screener





