

TD SYNNEX Q3FY26 Results: EPS beats by 21%, analysts raise targets


- Adjusted EPS of $5.68 beat consensus by 20.85%, up 58.66% YoY
- Revenue surged 37.75% YoY to $21.558 billion, beating estimates by 14.01%
- Morgan Stanley and UBS raised price targets to $359 and $379 respectively
- Q4 guidance implies continued strength with EPS of $5.65-$6.15 vs $4.87 estimate
- Free cash flow consumption of ~$1 billion driven by Hyve inventory buildup

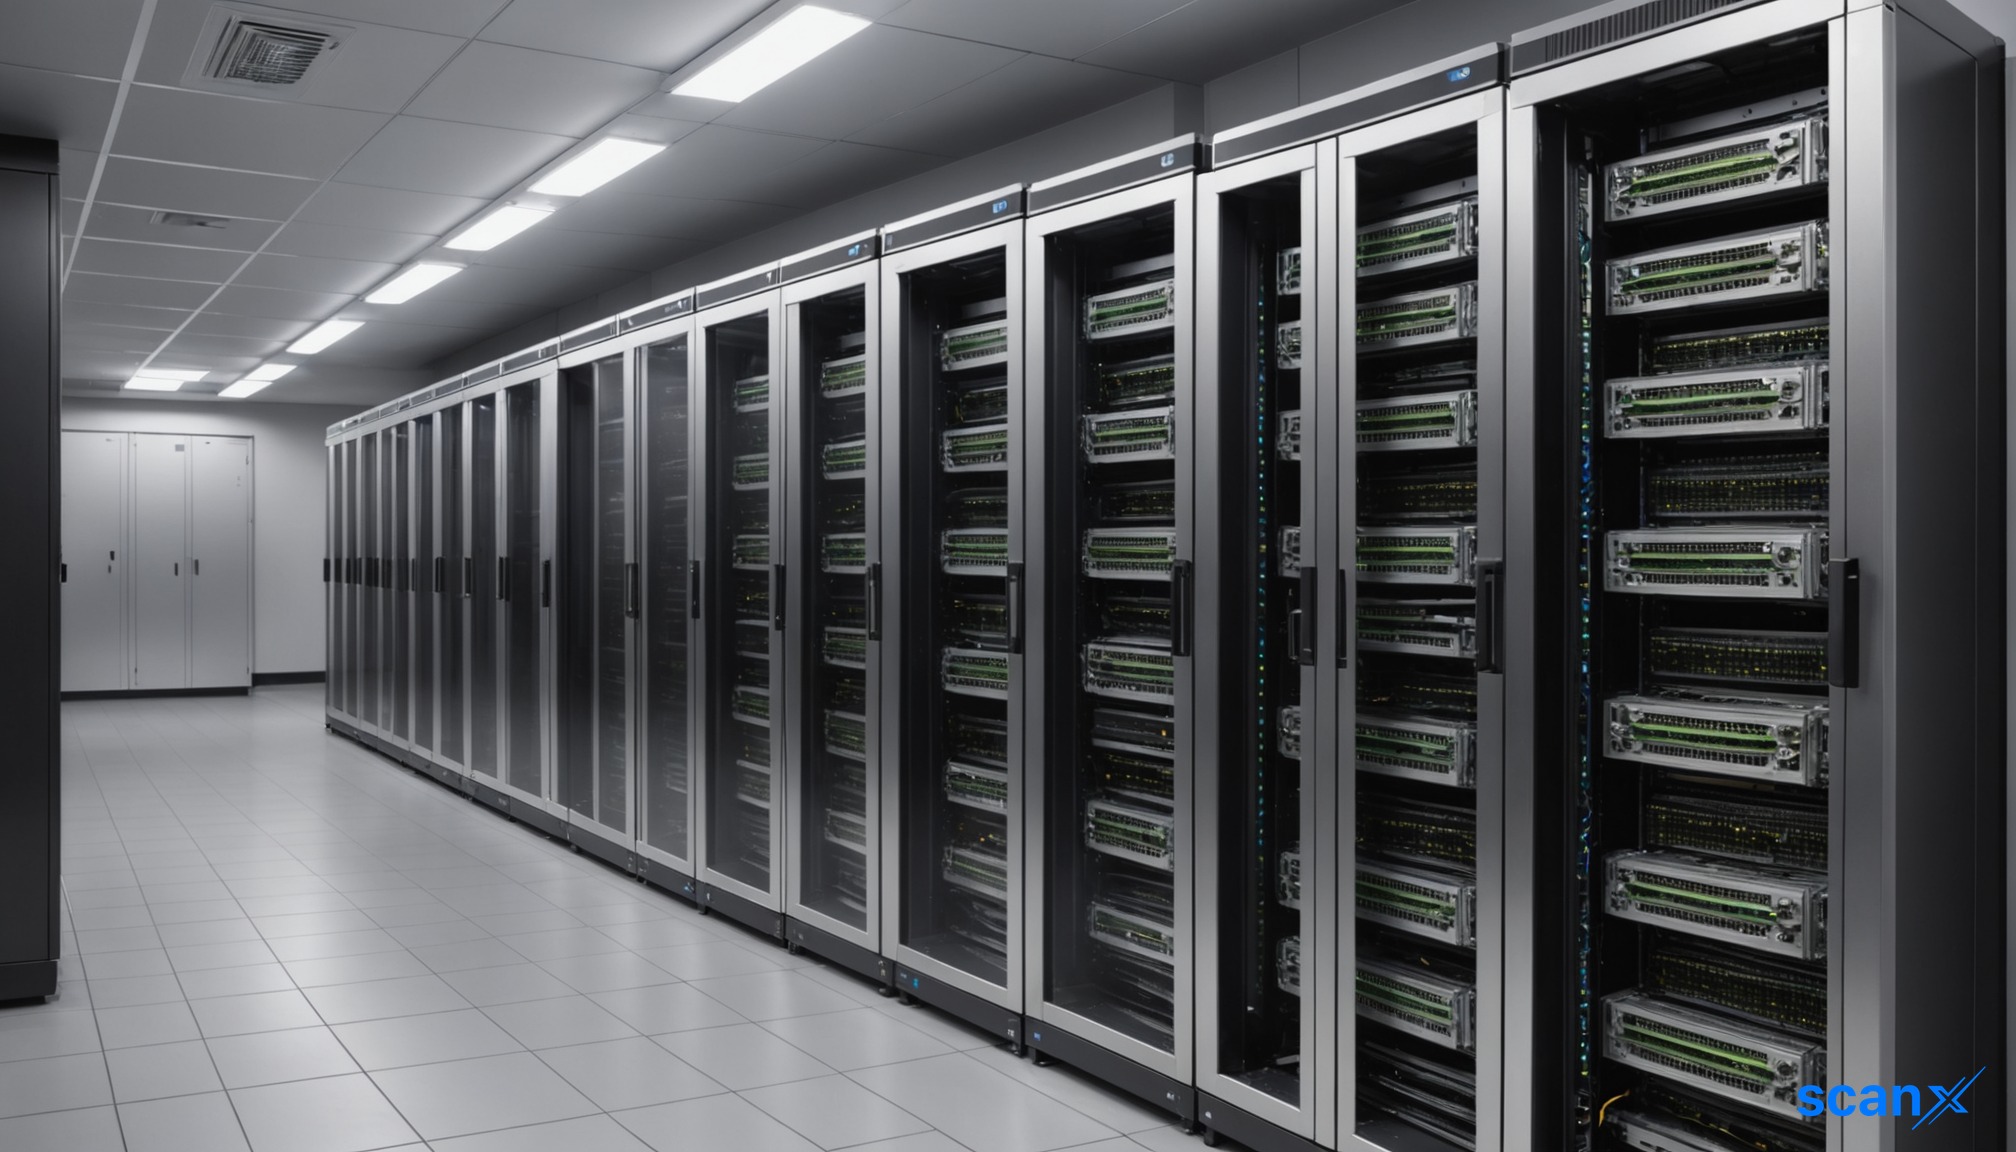

*this image is generated using AI for illustrative purposes only.
TD SYNNEX Corporation (NYSE: SNX) reported third-quarter adjusted earnings per share of $5.68, beating the analyst consensus estimate of $4.70 by 20.85%. This represents a 58.66% increase over the $3.58 earned in the same period last year. GAAP diluted EPS increased to $5.18 from $2.74. Following the announcement, shares gained 1.1% to trade at $262.39.
Quarterly sales reached $21.558 billion, surpassing the consensus estimate of $18.909 billion by 14.01%. Revenue grew 37.75% year-over-year from $15.650 billion reported in the prior year period. Non-GAAP gross billings, a key volume metric, rose 40.0% year-over-year to a record $31.8 billion, also exceeding the high end of the company's outlook.
Segment Performance: Distribution and Hyve
The company’s growth was driven by strong performance across both its Distribution and Hyve segments, with Hyve emerging as a significant contributor to top-line expansion. CEO Patrick Zammit noted that Hyve’s gross billings exceeded management’s expectations as hyperscaler programs continued to scale. Zammit stated, "We delivered another record quarter, with Distribution and Hyve both performing above our expectations and growing above market."
Distribution delivered non-GAAP gross billings of $24.8 billion, up 27% year-over-year. This segment exceeded expectations and grew above market across all regions. Key drivers included:
- Advanced Solutions: Gross billings increased 37%, driven by strength in infrastructure, software, and AI-related technologies.
- Endpoint Solutions: Gross billings rose 16%, supported by higher average selling prices for PCs despite a modest decline in unit volumes.
Hyve (formerly TechData) saw explosive growth, with non-GAAP gross billings increasing 117% to $7 billion. Hyve revenue specifically climbed 52% to $3.8 billion, while non-GAAP operating income for the segment increased 56% to $253 million. Growth was fueled by:
- Manufacturing: Grew more than 130%, representing approximately two-thirds of Hyve’s total billings.
- Supply Chain Services: Increased more than 90%, supported by component demand for customer infrastructure deployments.
Profitability and Operational Metrics
The company demonstrated significant operating leverage, with non-GAAP operating income rising 55.1% year-over-year to $736 million. GAAP operating income increased 67.6% to $643 million. Operating margins expanded across both measures: GAAP operating margin improved by 53 basis points to 2.98%, while non-GAAP operating margin increased by 39 basis points to 3.42%.
Despite the revenue surge, consolidated gross margin contracted by 61 basis points to 6.61%, down from 7.22% in the prior year period. However, the absolute gross profit grew 26.2% to $1.425 billion, indicating that volume growth outweighed margin compression. Management attributed the margin contraction primarily to mix shifts, including larger infrastructure transactions with lower margins and the rapid scaling of Hyve’s manufacturing programs.
Capital Returns and Cash Flow Dynamics
TD SYNNEX returned $139 million to stockholders during the quarter through approximately $100 million in share repurchases and $38 million in dividends. Additionally, the Board of Directors declared a quarterly cash dividend of $0.48 per common share, marking a 9% increase year-over-year. This dividend is payable on October 30, 2026, to shareholders of record as of October 16, 2026.
Free cash flow consumption was approximately $1 billion during the quarter, driven by increased inventory in Hyve’s supply chain business to support new customer ramps. The company used $916.7 million of operating cash and reported negative free cash flow of $975.6 million. Net working capital closed at $6.5 billion, with a gross cash conversion cycle of 22 days, up five days sequentially and six days from a year earlier. The company ended the quarter with $749.3 million in cash and a 1.9-times net leverage ratio.
Q4 Guidance
The company issued fourth-quarter guidance indicating continued strength. TD SYNNEX expects adjusted EPS of $5.65 to $6.15, compared to the analyst consensus estimate of $4.87. Sales are projected to range between $21.800 billion and $22.600 billion, exceeding the consensus estimate of $19.363 billion. Non-GAAP gross billings for Q4 are forecasted at $31.4 billion to $32.4 billion.
Additionally, the company provided GAAP EPS guidance for Q4FY26 of $4.58 to $5.08. This range exceeds the current analyst consensus estimate of $3.94 for GAAP earnings.
Strategic Initiatives and Market Trends
Management highlighted several strategic developments supporting long-term growth:
- AI Factory Deployment: TD SYNNEX and Mach 3 Systems signed an agreement to support an NVIDIA AI factory powered by Vera Rubin NVL72 systems, one of the largest enterprise AI infrastructure deployments through the channel.
- IBM Expansion: IBM expanded its relationship with TD SYNNEX into 20 additional countries across Europe, Asia Pacific, and Latin America.
- Digital Engagement: Customers engaging through digital platforms like Partner First and Digital Bridge grew their spend at nearly twice the pace of similar customers.
- Data Center Demand: Zammit stated there are no signs of weakening data center demand, noting that available capacity still falls short of customer needs. The company also secured new Hyve customer programs expected to use expanded manufacturing capacity.
Analyst Ratings and Price Targets
Following the earnings announcement, several analysts raised their price targets for TD SYNNEX. Morgan Stanley analyst Erik Woodring maintained an Overweight rating but raised the price target from $334 to $359. Woodring holds an accuracy rate of 81%.
Similarly, UBS analyst David Vogt maintained a Buy rating and boosted the price target from $352 to $379. Vogt has an accuracy rate of 75%.
| Analyst | Firm | Rating | Price Target | Date | Accuracy |
|---|---|---|---|---|---|
| Erik Woodring | Morgan Stanley | Overweight | $359 | Sept. 15, 2026 | 81% |
| Huy Hardwick | Barclays | Equal-Weight | $287 | Sept. 8, 2026 | 68% |
| David Vogt | UBS | Buy | $379 | June 26, 2026 | 75% |
| Vincent Colicchio | Barrington Research | Outperform | $325 | June 26, 2026 | 61% |
| Michael Ng | Goldman Sachs | Buy | $300 | June 12, 2026 | 76% |
What the Numbers Show
The divergence between Hyve’s massive volume growth (117%) and its margin compression (operating margin down to 3.61% from 5.04%) highlights a strategic trade-off. While Hyve is rapidly scaling through large-scale manufacturing and supply chain services, these programs currently dilute margins compared to legacy operations. However, management notes that new programs awarded are neutral to accretive, suggesting margins may stabilize as newer, higher-margin networking programs ramp in fiscal 2027.
Furthermore, the $1 billion free cash flow outflow contrasts with the strong earnings beat, signaling that TD SYNNEX is front-loading working capital investments to support committed demand. With net leverage at 1.9x and a stated goal to generate cash in Q4 as these investments normalize, the near-term balance sheet strain appears deliberate rather than structural.

How will the anticipated normalization of Hyve's working capital investments in Q4 impact TD SYNNEX's free cash flow generation and net leverage ratio?
What specific factors will drive the stabilization of Hyve's operating margins as higher-margin networking programs ramp in fiscal 2027?
To what extent does the rapid scaling of Hyve’s manufacturing segment expose the company to supply chain volatility or component shortage risks?
 19
19










 Access Market Heat-map & Insights
  Create, Save & Share your Screener
  Use 200+ Screening Filters





