

Tarsons Products files FY26 BRSR report with safety and ESG metrics


- Tarsons Products filed its FY26 BRSR report covering ESG and governance metrics
- Workforce consists of 165 employees and 943 workers with high male dominance
- Scope 2 GHG emissions rose to 11,154.72 metric tonnes CO2e from 9,168.65
- Total energy consumption from non-renewable sources increased to 57,945.51 GJ
- Worker LTIFR was 1.13 with six recordable injuries reported during the year

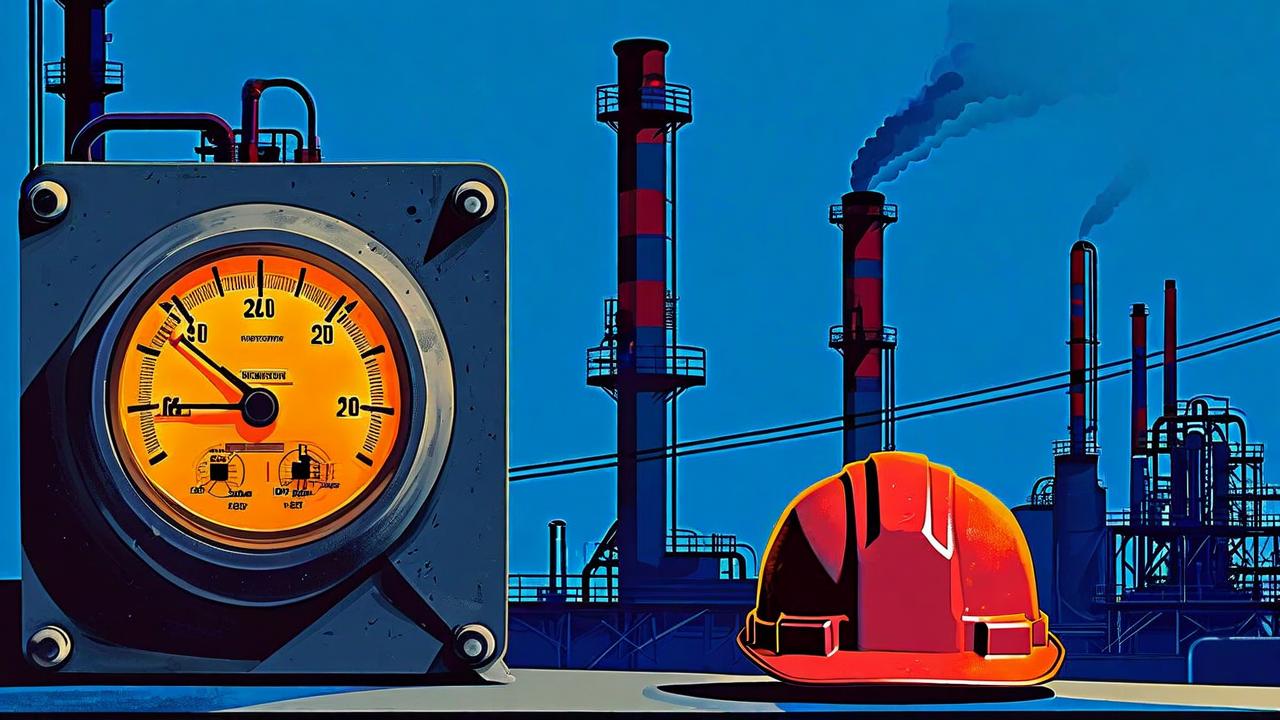

*this image is generated using AI for illustrative purposes only.
Tarsons Products submitted its Business Responsibility and Sustainability Report (BRSR) for the financial year ended March 31, 2026. The disclosure covers the company's environmental impact, social responsibility initiatives, and governance practices across its operations.
The report provides a standalone view of the entity's performance, detailing metrics related to energy consumption, waste management, and employee welfare. Tarsons operates seven plants and five offices nationally, serving markets in 28 Indian states and over 40 countries.
Workforce and Safety
As of March 31, 2026, the company employed 165 permanent employees and 943 permanent workers. The workforce is predominantly male, with men constituting 90.30% of employees and 99.89% of workers. Female representation stands at 9.70% among employees and 0.11% among workers.
Safety incidents recorded during the year include:
| Metric | Employees | Workers |
|---|---|---|
| Lost Time Injury Frequency Rate (LTIFR) | 0 | 1.13 |
| Total recordable work-related injuries | 0 | 6 |
| Fatalities | 0 | 0 |
The turnover rate for permanent employees rose to 25.45% in FY26 from 11.43% in FY25. Permanent worker turnover also increased to 21.47% from 9.05% in the prior year.
Environmental Metrics
Total energy consumption from non-renewable sources increased to 57,945.51 Giga Joules in FY26, up from 46,880.05 Giga Joules in FY25. Greenhouse gas emissions saw a divergence between scopes: Scope 1 emissions fell to 99.65 metric tonnes of CO2 equivalent from 106.38 metric tonnes, while Scope 2 emissions rose to 11,154.72 metric tonnes from 9,168.65 metric tonnes.
Water withdrawal totaled 4,087.78 kilolitres, primarily from groundwater (4,010.78 kilolitres) and third-party sources (77 kilolitres). Total waste generated decreased to 401.80 metric tonnes from 421.55 metric tonnes in the previous year, with all waste disposed of via landfilling.
Governance and Stakeholders
The Board of Directors comprises eight members, including two women (25% representation). No Key Managerial Personnel are female. The company reported zero complaints regarding conflict of interest, sexual harassment, or discrimination during FY26. Twelve customer complaints were received and resolved, compared to eight in FY25.
What the Numbers Show
Scope 2 emissions account for the vast majority of the company's carbon footprint, representing approximately 99% of total Scope 1 and Scope 2 combined emissions. This indicates that indirect emissions from purchased electricity are the primary driver of the company's greenhouse gas profile, rather than direct operational fuel use.
Historical Stock Returns for Tarsons Products
| 1 Day | 5 Days | 1 Month | 6 Months | 1 Year | 5 Years |
|---|---|---|---|---|---|
| 0.0% | +10.97% | -2.75% | +88.58% | +8.38% | -59.01% |

What specific strategies is Tarsons Products implementing to reduce its Scope 2 emissions, given that they account for 99% of its carbon footprint?
How does the sharp increase in employee turnover from 11.43% to 25.45% impact the company's operational efficiency and recruitment costs?
Are there plans to diversify waste disposal methods beyond landfilling to align with circular economy principles?
 16
16





 Access 50+ Readymade Screeners
  Use 200+ Custom Filters
  Get Full Market Insights





