

Supreme Petrochem profit surges 192% in Q1 FY27 on widened global deltas


Supreme Petrochem's Q1 FY27 net profit surged 192% to ₹2,363 million despite a 24.5% volume decline, driven by expanded operating EBITDA margins of 19.53% due to favorable global deltas. Management confirmed ₹900 crore in internal CAPEX for capacity expansions in Polystyrene, XPS, and Compounding, targeting completion by March 2029.


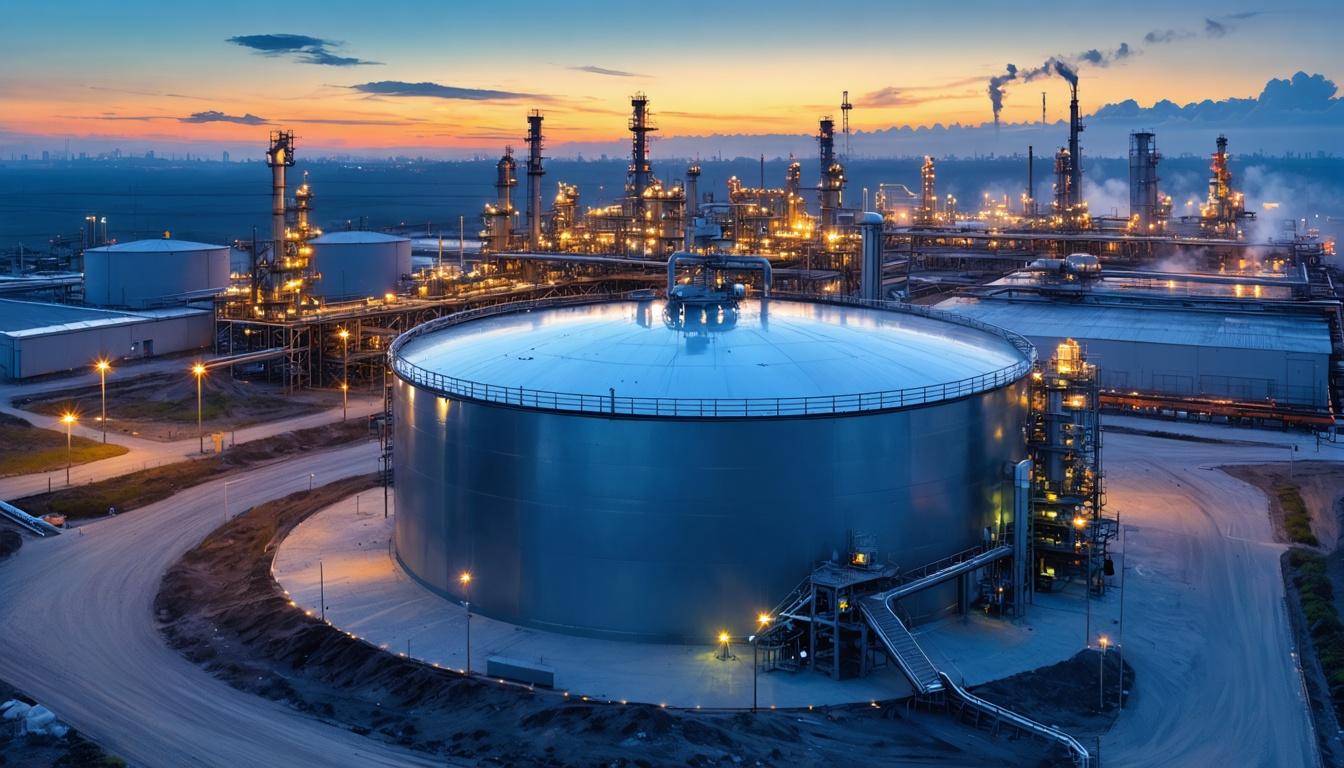
*this image is generated using AI for illustrative purposes only.
Supreme Petrochem reported a standalone net profit of ₹2,363 million for the first quarter ended June 30, 2026 (Q1 FY27), marking a 192.1% year-on-year increase from ₹809 million in Q1 FY26. The significant profit growth was driven by an expansion in operating EBITDA margins to 19.53%, up from 8.27% in the corresponding quarter of FY26, despite a 24.5% decline in total sales volume. This margin improvement occurred against a backdrop of suspended exports and subdued domestic demand, highlighting the company's ability to maintain profitability through an improved delta between styrene monomer and polystyrene prices. Executive Director and CFO Rakesh Nayyar stated that the wider delta in international markets between Styrene Monomer and downstream products significantly benefited the results.
The Board of Directors approved the unaudited financial results on July 27, 2026, under Regulation 30 of the SEBI (Listing Obligations and Disclosure Requirements) Regulations, 2015. Statutory auditors Kalyaniwalla & Mistry LLP issued an unmodified conclusion on the standalone and consolidated results. The company published these unaudited financial results in Business Standard and Pudhari on July 29, 2026, in compliance with Regulation 47 of the SEBI (Listing Obligations and Disclosure Requirements) Regulations, 2015.
Financial Performance Highlights
Standalone revenue from operations rose 22.1% to ₹16,927 million in Q1 FY27, compared to ₹13,865 million in Q1 FY26. Operating EBITDA surged 188.1% to ₹3,305 million, while total EBITDA (including other income) reached ₹3,479 million. Profit before tax (PBT) stood at ₹3,169 million, resulting in a PAT margin of 13.96%, significantly higher than the 5.83% recorded in the prior year. Consolidated net profit attributable to owners was ₹23,732 million, with basic and diluted EPS at ₹12.62. Finance costs remained low at ₹34 million, comprising primarily interest on lease obligations under Ind AS 116.
| Metric | Q1 FY27 (₹ Mn) | Q1 FY26 (₹ Mn) | YoY Change |
|---|---|---|---|
| Revenue from Operations | 16,927 | 13,865 | 22.1% |
| Operating EBITDA | 3,305 | 1,147 | 188.1% |
| Operating EBITDA Margin | 19.53% | 8.27% | +1,126 bps |
| Net Profit After Tax | 2,363 | 809 | 192.1% |
| Diluted EPS (₹) | 12.57 | 4.30 | NA |
Operational Challenges and Strategic Moves
Total sales volume declined to 70,842 MT in Q1 FY27 from 93,853 MT in Q1 FY26. This reduction was attributed to the suspension of exports due to the closure of the Strait of Hormuz, which halted styrene supplies from Gulf suppliers. Consequently, international freight rates rose, and shipping capacity decreased. Domestically, demand from non-OEM customers remained subdued due to sharp price increases, with Nayyar noting that almost 50% of demand from the non-OEM segment had evaporated in this quarter. Increased imports of commodity polymers, estimated at around 20,000 tons due to temporary duty exemptions, also eroded market share.
Despite these challenges, the company established alternate supply arrangements to meet domestic customer requirements. Nayyar clarified that while exports were minimal—barely 10-12% of normal quarterly levels—OEM demand remained stable and good. The company is currently sourcing styrene from alternative markets, which involves higher freight costs and longer voyage times compared to traditional Gulf supplies.
Capacity Expansion and Sustainability
The Board approved a new Polystyrene production line at the Amdoshi Complex in Maharashtra, adding 80,000 TPA capacity. This investment is part of a broader CAPEX plan totaling approximately ₹900 crore, funded entirely through internal accruals. Nayyar confirmed that all capacities, including expansions in XPS production (from 72,000 cubic meters to 122,000 cubic meters via a new 150,000 cubic meter wide-width board line) and compounding capacity (from 50,000 TPA to 80,000 TPA), will be commissioned by March 2029. Post-expansion, total Polystyrene capacity will reach 380,000 TPA. The company also completed the EPS Phase II expansion during the quarter. Supreme Petrochem continues its sustainability initiatives, with approximately 50% of power consumption met from renewable sources via a 12.5 MW solar plant joint venture with Tata Renewable Energy Ltd.
What the Numbers Show
The divergence between declining sales volumes (-24.5%) and surging net profit (+192%) underscores a strategic shift towards high-margin products or effective cost management amidst supply chain disruptions. While operational revenue grew moderately, the nearly tripling of EBITDA margins indicates that the company successfully passed on input cost increases or benefited from favorable product mix shifts. Nayyar noted that current global deltas for GPPS are closer to USD 250-275 and HIPS around USD 350, down from peak aberrations of USD 300+ and USD 400+ respectively. The debt-free balance sheet and substantial cash reserves provide a strong foundation for executing planned capacity expansions without diluting equity, targeting a 2x asset turnover on full capacity basis.
Historical Stock Returns for Supreme Petrochem
| 1 Day | 5 Days | 1 Month | 6 Months | 1 Year | 5 Years |
|---|---|---|---|---|---|
| +0.89% | -4.80% | -4.65% | +7.23% | -0.31% | +109.17% |

How sustainable are the current widened deltas between Styrene Monomer and polystyrene prices, and what is the risk of margin compression as global supply chains normalize post-Hormuz disruption?
Given the 50% evaporation in non-OEM demand, how does Supreme Petrochem plan to recapture this market share once temporary duty exemptions on imported commodity polymers expire?
With the ₹900 crore CAPEX for capacity expansion funded entirely by internal accruals, will the company maintain its debt-free status while managing the increased working capital requirements of the new 80,000 TPA Polystyrene line?
 15
15








 Access 50+ Readymade Screeners
  Use 200+ Custom Filters
  Get Full Market Insights





