

Skyways Air Services Q1FY27 Results: Revenue up 90% to ₹1,216 crore


- Revenue surged 90.4% YoY to ₹1,216.53 crore, driven by 23% volume growth in air cargo and 64% realization gains in ocean freight.
- Consolidated EBITDA rose 83.5% YoY to ₹50.12 crore, with PAT more than doubling to ₹26.79 crore.
- Skyways retained its #1 position in Indian air freight forwarding, improving global rank to 44th and market share to 6.2%.
- Board approved ₹30 crore for expansion into five new Asian markets and ₹20 crore for existing subsidiaries in UAE, KSA, and Vietnam.
- Pharmaceutical segment mix increased to 23% of business following Odyssey acquisition, with Odyssey standalone revenue reaching ₹182 crore.


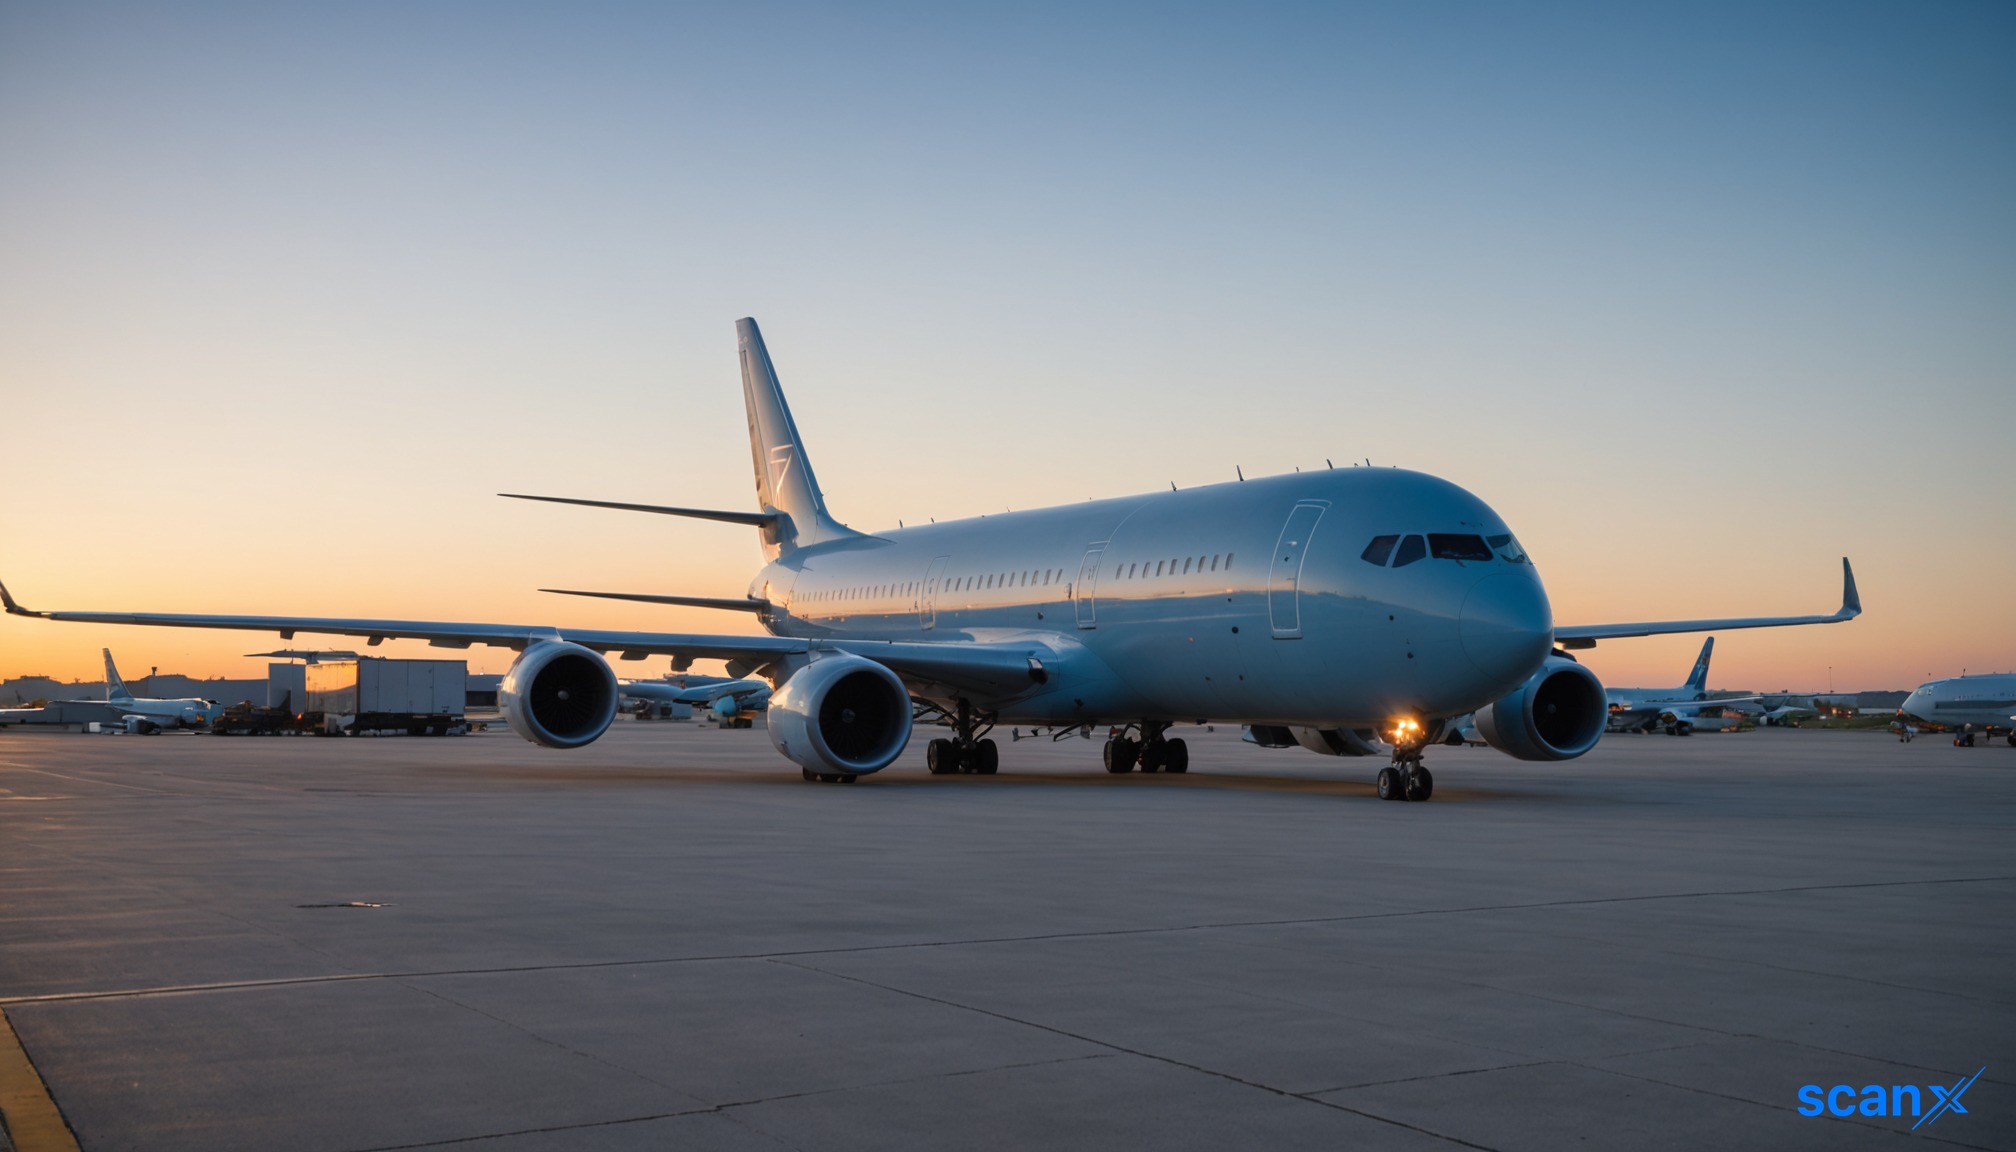
*this image is generated using AI for illustrative purposes only.
Skyways Air Services reported a 90.4% year-on-year increase in operating revenue to ₹1,216.53 crore for Q1FY27, driven by a 23% volume growth in air cargo and a 64% rise in ocean freight realizations.
The company’s consolidated operating EBITDA surged 83.5% YoY to ₹50.12 crore, while Profit After Tax (PAT) climbed from ₹11.01 crore in Q1FY26 to ₹26.79 crore in Q1FY27. This performance marks the first earnings call following the company's recent listing, highlighting a strong start to its public market journey.
Financial Performance Highlights
The quarter witnessed significant improvements across key metrics, with management attributing the revenue jump to both volume expansion and higher per-unit costs due to global fuel index increases. The PAT margin expanded to 2.2% from 1.72% in the corresponding quarter last year, aided by better cost control.
| Metric | Q1FY27 | Q1FY26 | Change |
|---|---|---|---|
| Operating Revenue | ₹1,216.53 crore | ₹639 crore | +90.4% |
| Operating EBITDA | ₹50.12 crore | ₹27.31 crore | +83.5% |
| Net Profit (PAT) | ₹26.79 crore | ₹11.01 crore | +143.3% |
| Air Cargo Volume Growth | 23% | N/A | N/A |
| Ocean Freight Realization | +64% | N/A | N/A |
Employee benefit expenses as a percentage of revenue decreased to 2.94% from 4.41% YoY, while other expenses dropped to 1.76% from 2.5%. Management noted that fuel costs are passed through to customers, meaning yield fluctuations are largely market-driven rather than operational margin drivers.
Strategic Expansion and Market Position
Skyways retained its position as India’s number one air freight forwarder by chargeable volumes, according to WorldACD data, and improved its global ranking to 44th. The Indian market share strengthened from 5.9% to 6.2% on a quarter-on-quarter basis. The company successfully navigated geopolitical disruptions, including the West Asia crisis, by leveraging global carrier contracts to secure alternate capacities.
The Board has approved an investment of ₹30 crore for expanding into five new Asian geographies, including China, Malaysia, and Singapore. Additionally, ₹20 crore is allocated for existing subsidiaries in the UAE, Saudi Arabia, and Vietnam. Management estimates a break-even period of 2 to 3 years for new markets at the PAT level, with EBITDA break-even expected within 15 to 18 months.
Technology and Segment Updates
A key focus remains on technology integration. The company is launching a unified multimodal platform called ASAP within 30 to 60 days, aiming to streamline booking across air, ocean, express, and trucking services. This platform targets Tier 2 and Tier 3 markets to enhance customer acquisition and pricing transparency.
In terms of business mix, air cargo contributed approximately 81% of revenue in Q1FY27, up from 77% in FY26. The pharmaceutical segment, bolstered by the Odyssey acquisition, now constitutes 23% of the business mix, up from 8-9% pre-acquisition. Odyssey’s standalone revenue grew to ₹182 crore in Q1FY27 from ₹130 crore in the previous quarter.
Debt Reduction and Outlook
Post-IPO, Skyways has repaid approximately ₹140 crore of borrowings, which is expected to reduce finance costs in subsequent quarters. While absolute finance costs rose to ₹17.7 crore in Q1FY27, the percentage cost relative to revenue remained stable. Management indicated that volume growth trends are continuing into Q2FY27, with no specific annual revenue guidance provided, consistent with industry practice.
What the Numbers Show
The divergence between the 90.4% revenue growth and the 23% air cargo volume growth highlights that nearly two-thirds of the top-line expansion was driven by price realization rather than pure volume. This suggests that while demand was robust, the primary financial benefit in Q1FY27 came from the pass-through of elevated fuel costs and favorable freight rates. However, the simultaneous improvement in EBITDA margins (4.1% vs 4.3% implied prior year base calculation context) and PAT margins indicates that Skyways successfully captured incremental value beyond mere cost recovery, likely through optimized trade lane mixes and higher-margin pharmaceutical cargo.
Historical Stock Returns for Skyways Air Services
| 1 Day | 5 Days | 1 Month | 6 Months | 1 Year | 5 Years |
|---|---|---|---|---|---|
| +0.95% | +0.20% | -2.71% | -19.92% | -19.92% | -19.92% |

How will the 2-3 year break-even timeline for new Asian geographies impact Skyways' near-term profitability and cash flow generation?
What specific strategies will the ASAP multimodal platform employ to capture market share in Tier 2 and Tier 3 cities against established competitors?
Given that fuel costs are passed through, how sustainable is the current EBITDA margin expansion if global freight rates normalize in subsequent quarters?
 17
17



 Create Custom Screeners
  Access 200+ Pre-built Filters
  Use 50+ Readymade Screener





