

Sintercom wins Rs 0.365 crore work order from Larsen & Toubro for EV motor components


- Sintercom wins a confirmed Rs 0.365 crore purchase order from Larsen & Toubro for EV motor half rings.
- Execution is scheduled by October 2026, marking the first disclosed order in the last three quarters.
- Financial context shows zero TTM revenue and profit, rendering book-to-bill and backlog metrics not applicable.
- Valuation at 133.0x P/E (as of 28 Aug 2026) significantly exceeds the 4.85% ROCE, reflecting high growth expectations.
- Investors should monitor revenue recognition and order scaling in upcoming quarters to validate commercial traction.

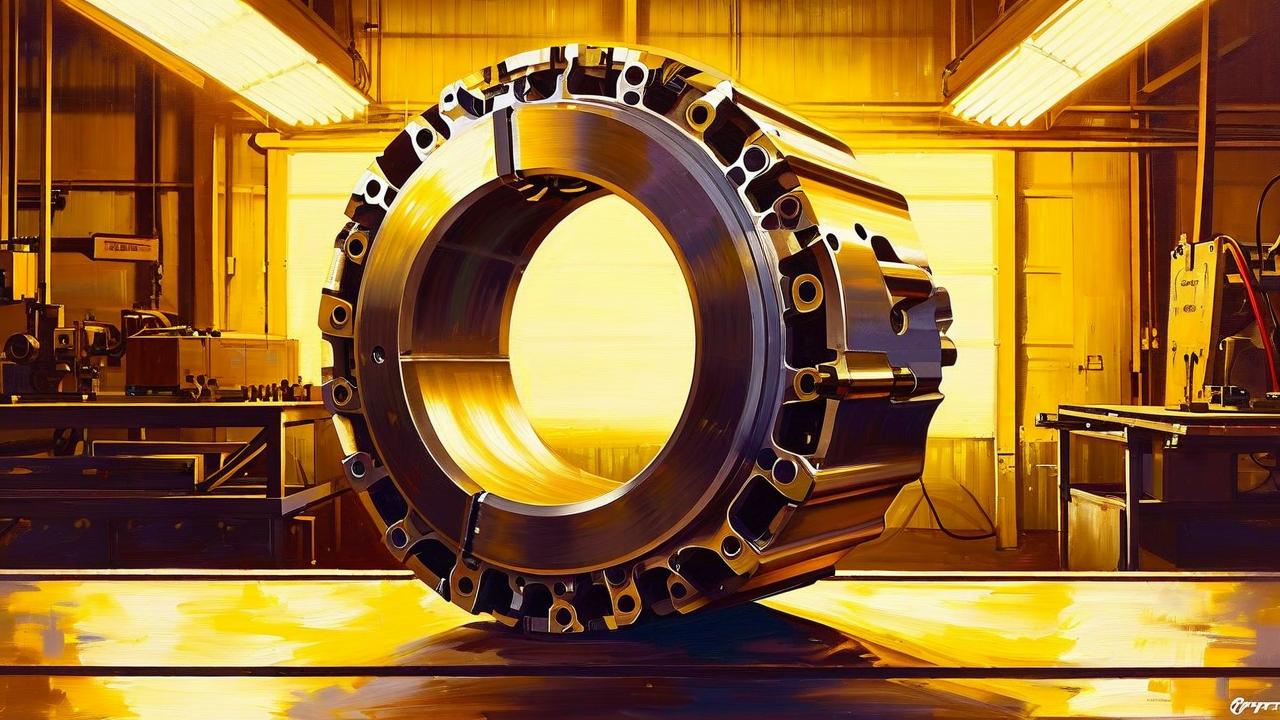

*this image is generated using AI for illustrative purposes only.
Sintercom has won a confirmed purchase order worth Rs 0.365 crore from Larsen & Toubro Limited, Mobility Plant - Coimbatore (L&T Electronic Product & System- L&T EPS). The contract covers the supply of half rings for two-wheeler electric vehicle motors, with execution scheduled by October 2026.
ORDER IN FINANCIAL CONTEXT
The Rs 0.365 crore order is a confirmed work order, providing firm revenue visibility once delivered. However, financial metrics offer limited context due to the company's current operational scale. The company reported zero revenue over the trailing twelve months, making traditional book-to-bill analysis and backlog coverage calculations not applicable. This single disclosure stands as the only recorded order inflow in the last three fiscal quarters, marking the beginning of disclosed commercial traction rather than a continuation of an existing pipeline.
COMPANY ORDER TRACK RECORD
No previous order disclosures were found for the company in the last three fiscal quarters. This filing represents the first visible entry in the recent order history, indicating either a new phase of business development or a lack of prior material disclosures meeting SEBI Regulation 30 thresholds.
EXECUTION AND REVENUE QUALITY
The company’s recent financial performance reflects minimal commercial activity. Consolidated revenue, net profit, and operating profit were all zero for the trailing twelve months. Consequently, operating profit margins cannot be calculated. The absence of revenue suggests that prior orders, if any, have not yet converted to billable milestones or that the company is in a pre-revenue ramp-up phase.
| Quarter | Revenue (Rs Cr) | Net Profit (Rs Cr) | OPM (%) |
|---|---|---|---|
| TTM | 0.0 | 0.0 | 0.0% |
WORKING CAPITAL AND EXECUTION CAPACITY
With zero operating cash flow and no reported liabilities or equity details in the provided fundamental context, a detailed liquidity assessment is not possible from this data set. However, the small order size of Rs 0.365 crore implies minimal working capital requirements for execution. The company’s ability to fund larger future contracts will depend on its balance sheet strength, which currently shows negligible operational leverage.
WHAT TO WATCH
- Order scaling: Monitor whether this initial Rs 0.365 crore order leads to larger volume contracts with L&T or other EV manufacturers.
- Revenue recognition: Track the next quarterly results to see if this order translates into actual billed revenue and cash inflows.
- Margin quality: Assess gross margins on these EV components once production begins, as component manufacturing can be margin-sensitive.
- Client diversification: Observe if the company secures orders from other major OEMs to reduce dependency on a single client like L&T.
KEY OBSERVATIONS
- Valuation check (as of 28 Aug 2026): P/E of 133.0x against ROCE of 4.85%. At the time of this article, valuation was pricing in execution improvement not yet visible in return ratios. (P/E is price-derived and will change; ROCE is from audited financials)
- Zero revenue base: The company reported zero revenue and zero profit in the TTM period, indicating that current valuations are driven by future growth expectations rather than existing earnings power.
Historical Stock Returns for Sintercom
| 1 Day | 5 Days | 1 Month | 6 Months | 1 Year | 5 Years |
|---|---|---|---|---|---|
| +2.20% | +5.82% | +3.50% | -6.44% | -36.74% | 0.0% |

 19
19






 Access Market Heat-map & Insights
  Create, Save & Share your Screener
  Use 200+ Screening Filters





