

Shree Pushkar Chemicals files FY26 sustainability report with 31% green capex


- Capital expenditure for environmental improvements rose to 30.98% in FY26 from 23.21% in FY25
- Solar power now meets 65-70% of the plant's electrical energy demand via open access
- Total energy consumption increased significantly to 28,26,233.38 GJ, raising energy intensity
- Zero lost-time injuries and fatalities were reported for employees and workers in FY26
- Human rights training coverage achieved 100% across all permanent staff categories

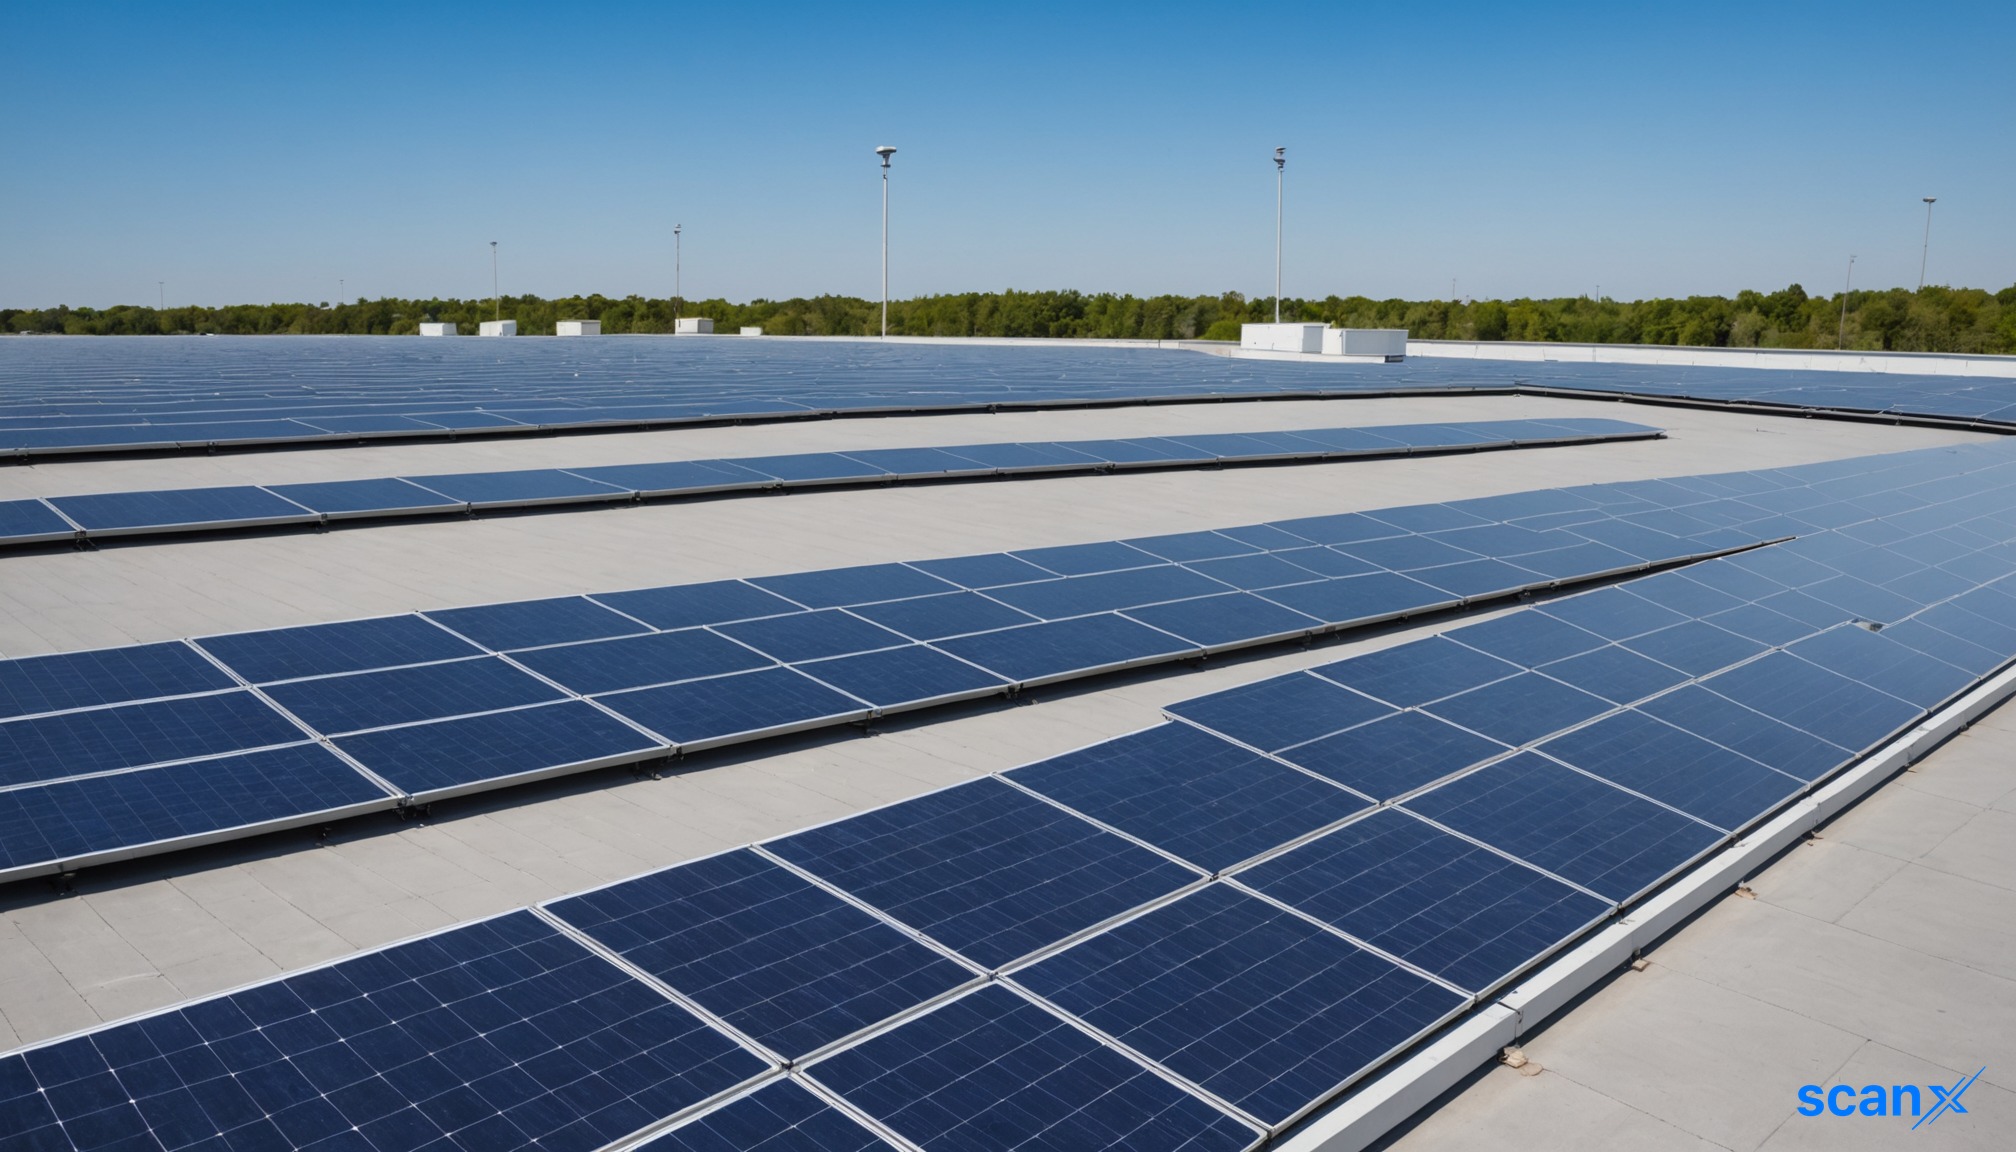

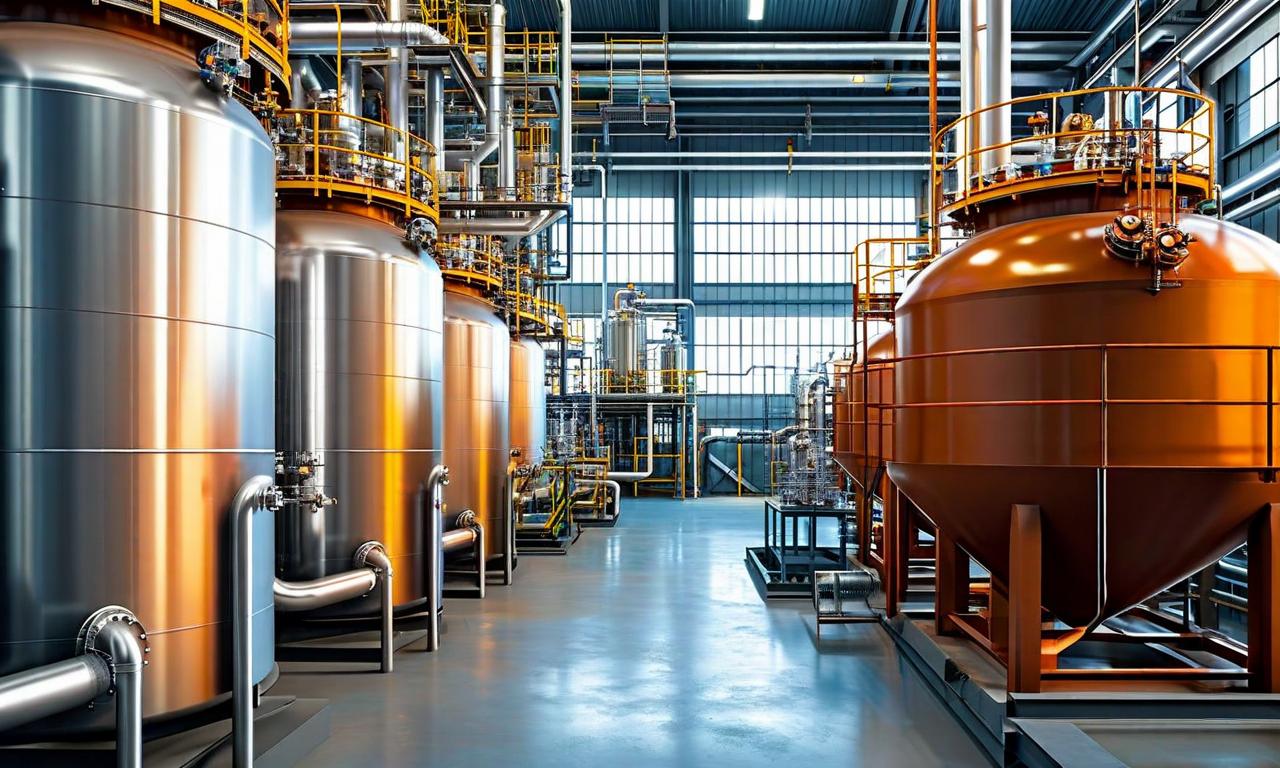
*this image is generated using AI for illustrative purposes only.
Shree Pushkar Chemicals filed its Business Responsibility and Sustainability Report for FY26 on September 4, 2026. The disclosure, submitted to the National Stock Exchange and BSE Limited, outlines the company’s environmental, social, and governance metrics for the financial year ending March 31, 2026.
The company reported a significant shift in capital expenditure allocation toward sustainable operations. Approximately 30.98% of total capital expenditure was directed toward technologies improving environmental impact, up from 23.21% in FY25. This investment primarily funded solar power infrastructure, which now meets 65-70% of the plant’s electrical energy demand through open access.
What the Numbers Show
A clear divergence exists between the company’s renewable energy adoption and its overall energy intensity. While renewable electricity consumption surged from 17,300.10 GJ in FY25 to 41,625.44 GJ in FY26, total energy consumption rose sharply from 7,39,446.43 GJ to 28,26,233.38 GJ. Consequently, energy intensity per rupee of turnover increased from 0.0000917106 to 0.0002893876, suggesting that operational scale or non-renewable fuel usage outpaced efficiency gains from solar integration during the period.
Environmental Metrics
Total water withdrawal increased to 91,403 kilolitres in FY26, compared to 81,497 kilolitres in FY25. The company discharged 6,644 kilolitres of treated water to third parties, up from 2,737 kilolitres the prior year. Waste generation rose to 586.2 metric tonnes, driven by an increase in plastic waste (301 metric tonnes) and other hazardous waste (278 metric tonnes).
| Metric | FY26 | FY25 |
|---|---|---|
| Renewable Energy Consumption (GJ) | 41,625.44 | 17,300.10 |
| Total Energy Consumption (GJ) | 28,26,233.38 | 7,39,446.43 |
| Water Withdrawal (kilolitres) | 91,403 | 81,497 |
| Total Waste Generated (tonnes) | 586.2 | 472.40 |
Social and Governance Highlights
The company reported zero lost-time injury frequency rates and zero fatalities for both employees and workers in FY26. Human rights training coverage reached 100% for all permanent employees and workers, up from 90.23% for total workers in FY25. Related-party transactions remained minimal, with purchases at 1.46% and sales at 0.93% of total volumes.
Historical Stock Returns for Shree Pushkar Chemicals
| 1 Day | 5 Days | 1 Month | 6 Months | 1 Year | 5 Years |
|---|---|---|---|---|---|
| -0.25% | -0.87% | +8.88% | +63.13% | +10.62% | +120.70% |

How does Shree Pushkar Chemicals plan to decouple its rising total energy consumption from turnover growth in FY27?
What specific waste management strategies will be implemented to address the sharp increase in plastic and hazardous waste generation?
Will the company expand its solar infrastructure beyond open access to further reduce reliance on non-renewable energy sources?
 16
16









 Access Market Heat-map & Insights
  Create, Save & Share your Screener
  Use 200+ Screening Filters





