

Sharvaya Metals FY26 Results: Revenue doubles 104% YoY to ₹229.8 crore


- Revenue doubled 104.3% YoY to ₹229.83 crore in FY26
- Net profit fell 6.7% to ₹11.67 crore amid margin compression
- EBITDA declined 5.4% to ₹18.26 crore; margin dropped to 7.9%
- IPO raised ₹58.80 crore, strengthening net worth to ₹773.25 crore
- Expanded into high-strength 2xxx and 7xxx series aluminium extrusions

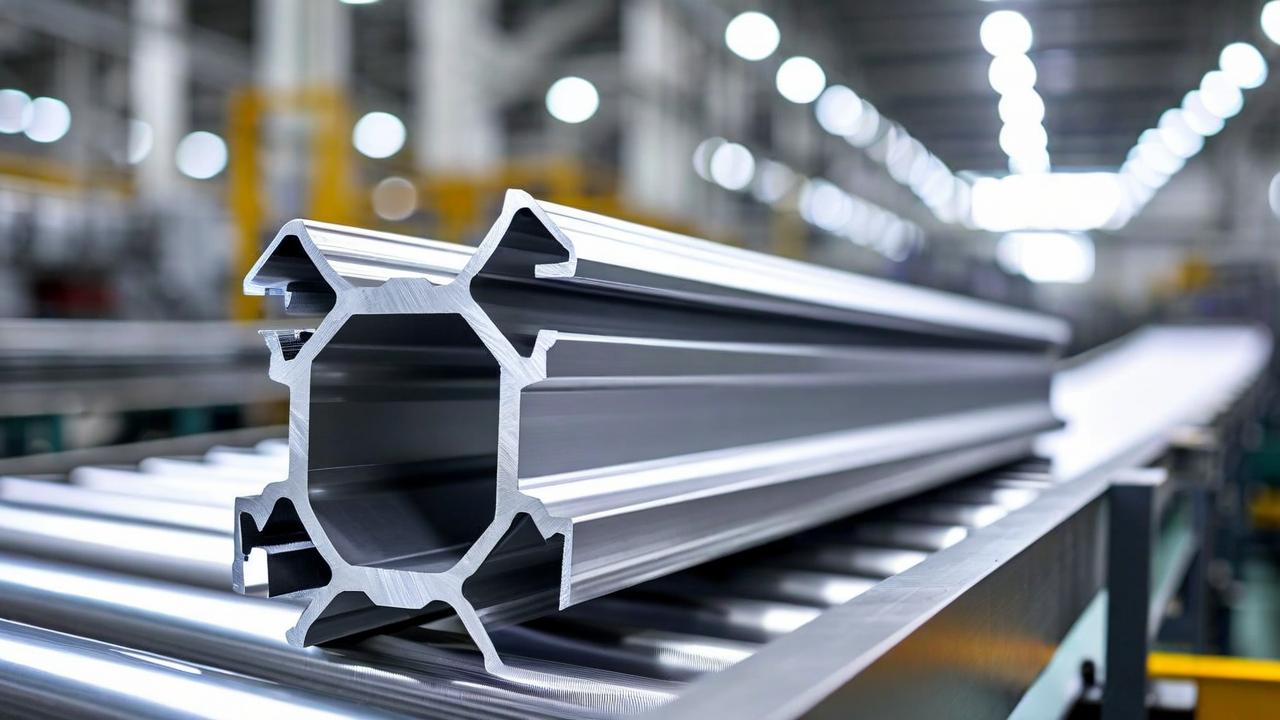

*this image is generated using AI for illustrative purposes only.
Sharvaya Metals reported a 104.3% year-on-year revenue surge to ₹229.83 crore for FY26, more than doubling its top line from ₹112.52 crore in the previous fiscal year. The Ahmednagar-based aluminium manufacturer also listed its equity shares on the BSE SME Platform in September 2025, raising ₹58.80 crore through an initial public offering.
Despite the significant topline growth, net profit after tax (PAT) declined by 6.7% to ₹11.67 crore from ₹12.51 crore in FY25. EBITDA contracted by 5.4% to ₹18.26 crore, reflecting margin compression amidst higher operational costs and working capital investments.
Financial Performance
The company’s financial results for the year ended March 31, 2026, highlight a divergence between volume growth and profitability.
| Metric | FY26 | FY25 | Change |
|---|---|---|---|
| Revenue from Operations | ₹229.83 crore | ₹112.52 crore | +104.3% |
| EBITDA | ₹18.26 crore | ₹19.30 crore | -5.4% |
| PAT | ₹11.67 crore | ₹12.51 crore | -6.7% |
| Basic EPS | ₹13.11 | ₹16.70 | -21.5% |
Revenue growth was supported by increased production volumes across its diversified portfolio of value-added aluminium products, including alloyed ingots, billets, slabs, and EV battery housings. However, cost of materials consumed rose sharply to ₹215.72 crore from ₹96.04 crore, outpacing revenue growth and pressuring margins.
What the Numbers Show
EBITDA margin contracted to 7.9% in FY26 from 17.2% in FY25. This significant compression indicates that while the company successfully scaled operations, it faced higher input costs or lower realizations that were not fully passed on to customers. Additionally, other expenses surged to ₹6.73 crore from ₹2.56 crore, primarily driven by a rise in invoice discounting charges to ₹1.40 crore from ₹0.22 crore, suggesting increased reliance on short-term financing for working capital needs.
Balance Sheet and Capital Structure
The IPO strengthened the company’s balance sheet significantly. Shareholder funds expanded by 240% to ₹773.25 crore from ₹227.78 crore, largely due to the fresh equity issuance. Consequently, the debt-to-equity ratio improved dramatically to 0.16 from 0.66.
Cash and cash equivalents stood at ₹2.03 crore as of March 31, 2026, up from ₹0.07 crore in the prior year. Inventories increased by 47% to ₹441.87 crore, reflecting stockpiling ahead of anticipated demand or ongoing production cycles. Trade receivables also rose sharply to ₹107.07 crore from ₹33.32 crore, indicating extended credit periods or larger order sizes.
Strategic Developments
Sharvaya Metals successfully developed production capabilities for 2xxx and 7xxx series aluminium extrusions during FY26. This expansion allows the company to serve high-performance applications in sectors such as defence, aerospace, and automotive, reducing dependence on imported high-strength aluminium. The company operates an integrated manufacturing facility with a capacity of 10,000 MTPA for aluminium extrusions and profiles.
Corporate Actions
The Board of Directors proposed the reappointment of Shreyans Katariya as Managing Director and Pukhraj & Associates as Statutory Auditors for five years. No dividend was declared for FY26. The 12th Annual General Meeting is scheduled for September 24, 2026, to transact these businesses.
Historical Stock Returns for Sharvaya Metals
| 1 Day | 5 Days | 1 Month | 6 Months | 1 Year | 5 Years |
|---|---|---|---|---|---|
| -1.85% | +28.31% | +30.64% | +119.61% | +6.71% | -6.75% |

How will Sharvaya Metals leverage its new 2xxx and 7xxx series extrusion capabilities to capture market share in the defence and aerospace sectors, and what is the projected timeline for revenue contribution from these high-margin products?
Given the sharp rise in trade receivables and invoice discounting charges, what specific credit control measures or working capital management strategies will the company implement to prevent further margin erosion in FY27?
With EBITDA margins compressing from 17.2% to 7.9%, does management plan to pass on increased raw material costs to customers through price adjustments, or will they focus on operational efficiencies to restore profitability?
 16
16








 Access 50+ Readymade Screeners
  Use 200+ Custom Filters
  Get Full Market Insights





