

Satia Industries files FY26 sustainability report, details ESG metrics


- Writing and printing paper manufacturing contributed 99.58% of total turnover in FY26
- Exports accounted for 6.38% of total revenue, serving five international countries
- Total energy consumption fell to 6,899.55 TJ, with renewables comprising 98.94%
- Permanent employee turnover rate was 15.75%, down slightly from 16.06% in FY25
- Hazardous waste generation decreased to 3,038.46 MT from 3,800.82 MT in the prior year

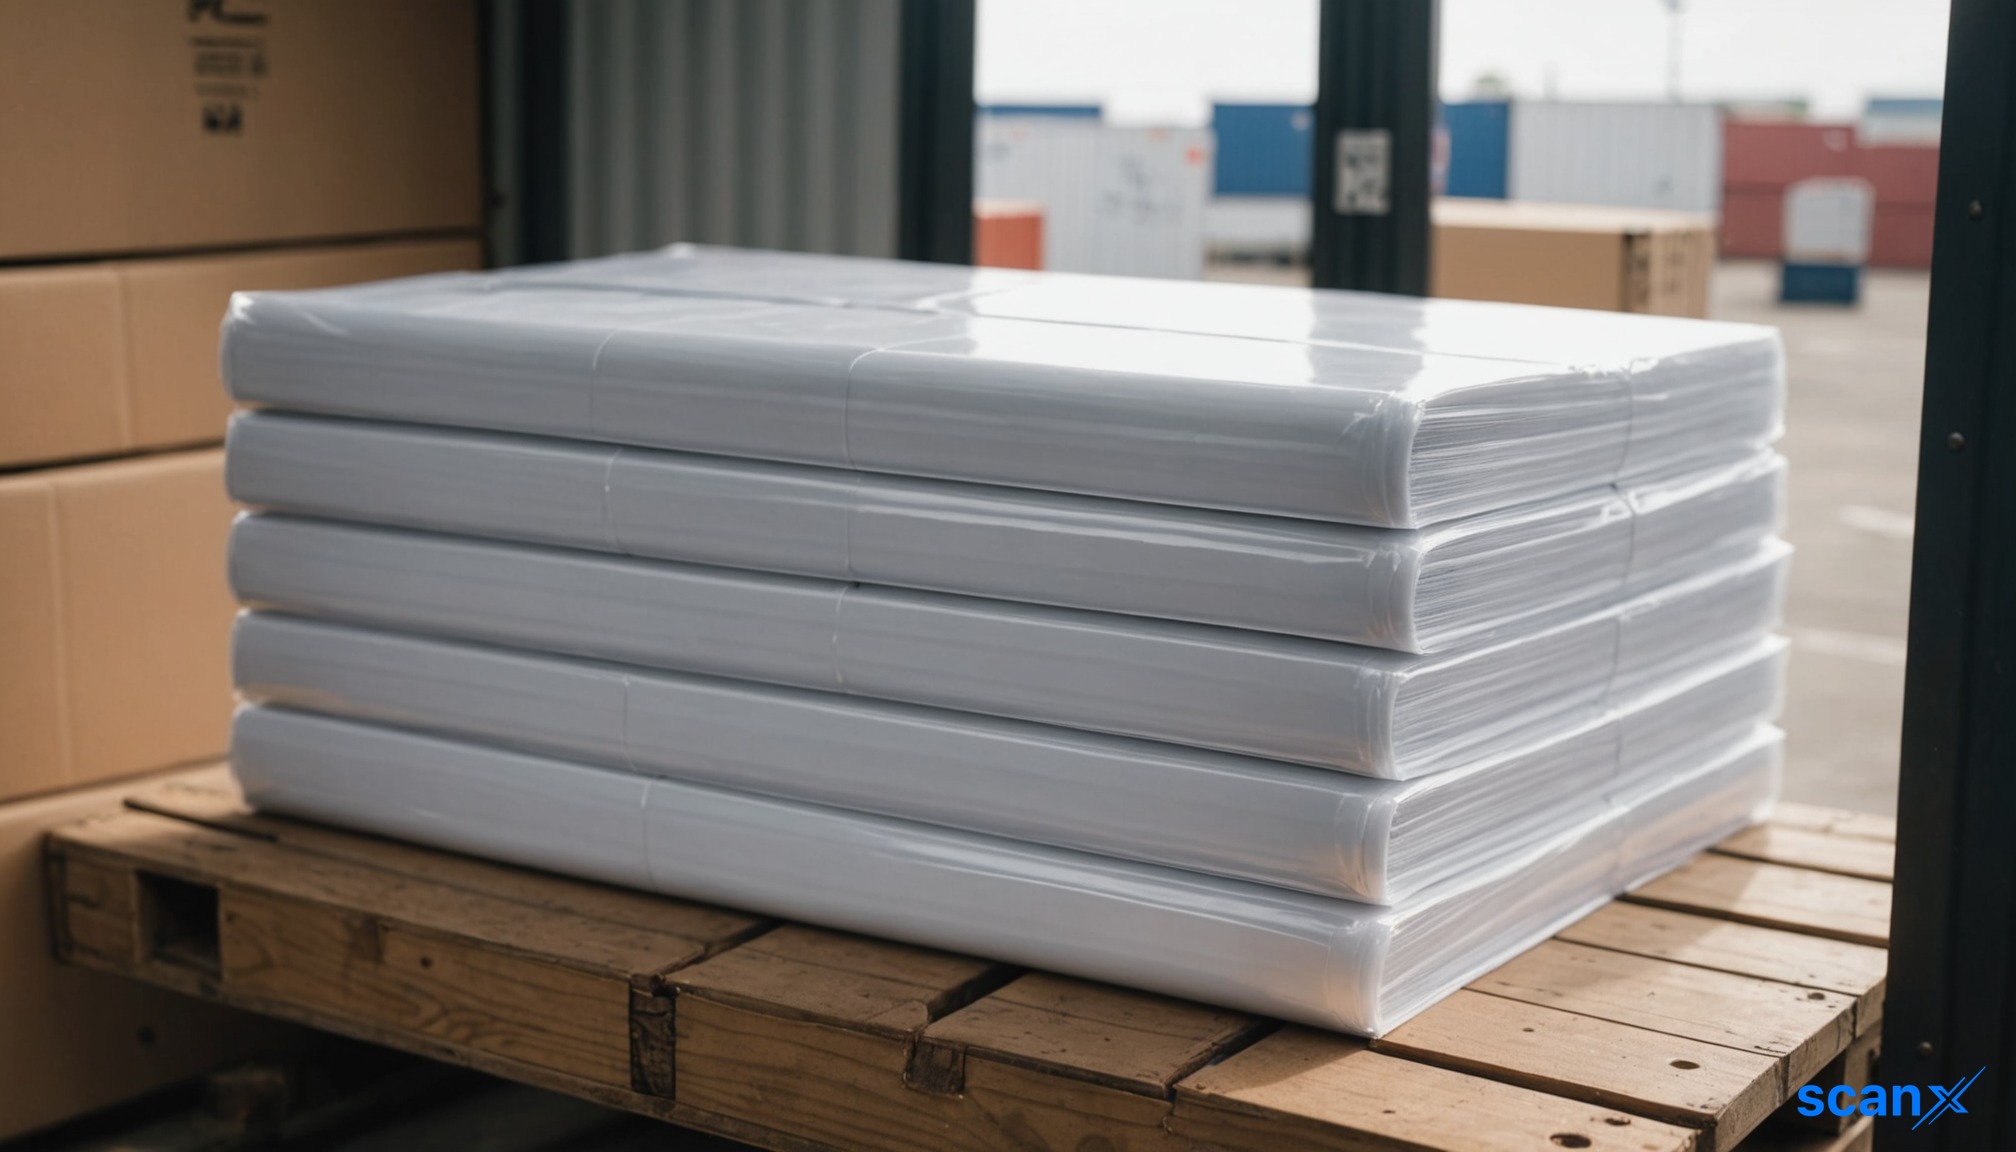

*this image is generated using AI for illustrative purposes only.
Satia Industries filed its Business Responsibility and Sustainability Report (BRSR) for the financial year ended March 31, 2026, in compliance with SEBI Listing Obligations regulations. The filing outlines the company’s operational footprint, governance structures, and environmental performance metrics for FY26.
Operational Overview
The company operates as an integrated wood and agro-based paper manufacturer. Its primary business activity is the manufacturing of writing and printing paper, which accounted for 99.58% of total turnover during the reporting period. Satia Industries serves a diversified customer base across domestic and international markets.
Exports contributed 6.38% of the total turnover in FY26. The company operates one plant and four offices nationally, with no international locations. It serves customers in 20 Indian states and union territories, alongside five international countries.
Workforce and Governance
As of the end of FY26, the company employed 672 permanent employees and 1,952 permanent workers. The workforce is predominantly male, with females constituting 2.23% of employees and 0.15% of workers.
The Board of Directors comprises 11 members, including one female director (9.09% representation). The company reported a turnover rate of 15.75% for permanent employees and 9.23% for permanent workers in FY26, compared to 16.06% and 12.39% respectively in FY25.
Environmental Metrics
Satia Industries disclosed detailed environmental data under Principle 6 of the BRSR framework:
| Metric | FY26 | FY25 |
|---|---|---|
| Total Energy Consumed (TJ) | 6,899.55 | 7,821.77 |
| Renewable Energy Share (%) | 98.94% | 99.34% |
| Water Withdrawal (KL) | 57,73,111 | 53,48,107 |
| Scope 1 Emissions (tCO2e) | 3,15,479.83 | 3,33,343.12 |
| Scope 2 Emissions (tCO2e) | 6,327.08 | 2,465.67 |
| Total Waste Generated (MT) | 3,116.22 | 3,891.02 |
The company utilizes agricultural residues such as wheat straw and sarkanda in its manufacturing process. Treated effluent is reused for irrigation purposes, including eucalyptus plantations, supporting water conservation initiatives. No treated effluent was discharged into surface water bodies.
What the Numbers Show
While total energy consumption declined by approximately 11.8% from FY25 to FY26, renewable energy remained the dominant source, accounting for nearly 99% of total usage. This indicates that the reduction in energy intensity was driven by overall efficiency gains rather than a shift away from renewable sources. Additionally, hazardous waste generation decreased significantly, falling from 3,800.82 MT in FY25 to 3,038.46 MT in FY26, suggesting improved waste management practices.
Historical Stock Returns for Satia Industries
| 1 Day | 5 Days | 1 Month | 6 Months | 1 Year | 5 Years |
|---|---|---|---|---|---|
| -0.38% | +0.76% | +8.90% | +14.22% | -16.52% | -28.83% |

How might Satia Industries' heavy reliance on agricultural residues like wheat straw expose it to supply chain volatility due to changing farming patterns or climate conditions?
Given the significant drop in total energy consumption, what specific operational efficiencies or technological upgrades drove this improvement, and can these gains be sustained in FY27?
With exports constituting only 6.38% of turnover, what strategic initiatives is the company pursuing to expand its international market share amidst global paper demand shifts?
 17
17




 Access 50+ Readymade Screeners
  Use 200+ Custom Filters
  Get Full Market Insights





