Satia Industries Reports Strong Q3FY26 Performance with Net Profit of ₹2,803 Lakhs


Satia Industries Limited reported strong Q3FY26 results with net profit of ₹2,803.00 lakhs versus ₹1,979.92 lakhs in Q3FY25, marking 41.58% growth. Revenue from operations reached ₹38,030.81 lakhs compared to ₹37,582.57 lakhs in the previous year. The cogeneration division drove profitability with segment results of ₹3,789.24 lakhs, while the paper segment showed improved losses. Nine-month performance reflected challenges with net profit declining to ₹3,511.57 lakhs from ₹8,319.46 lakhs in the corresponding period last year.
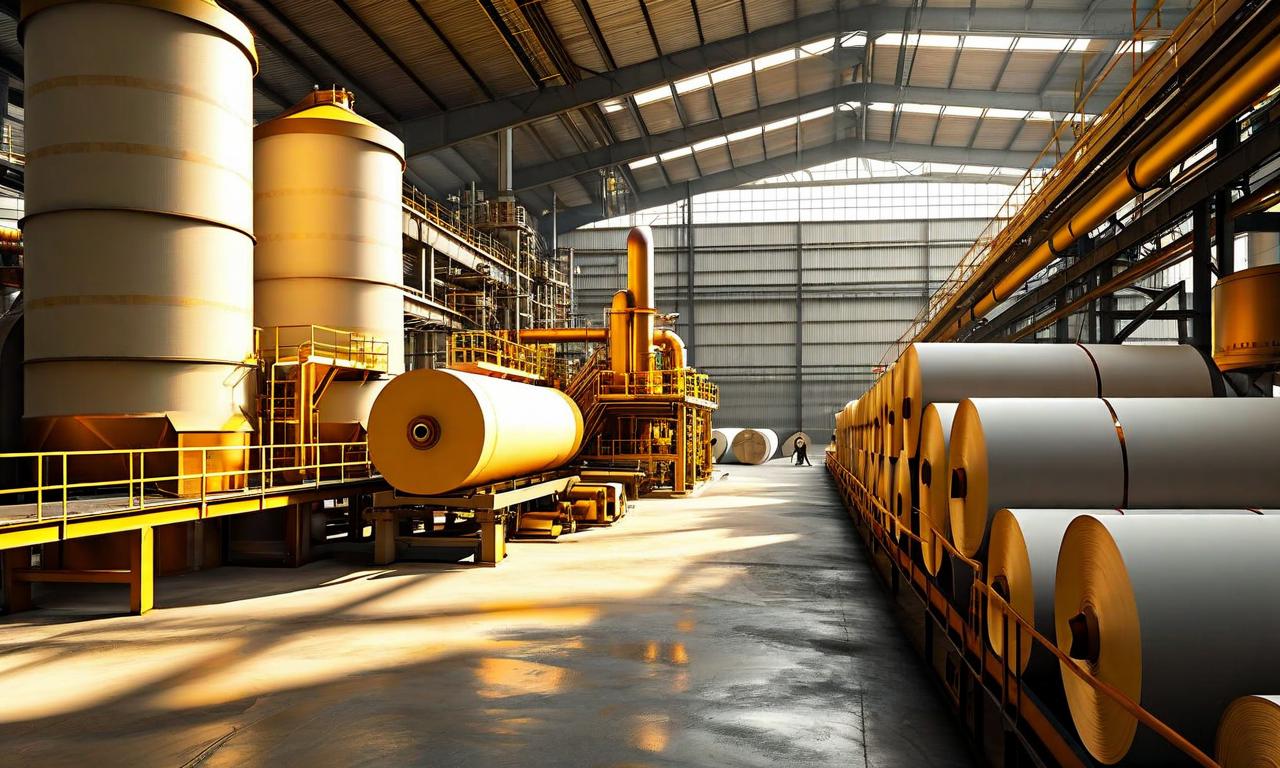

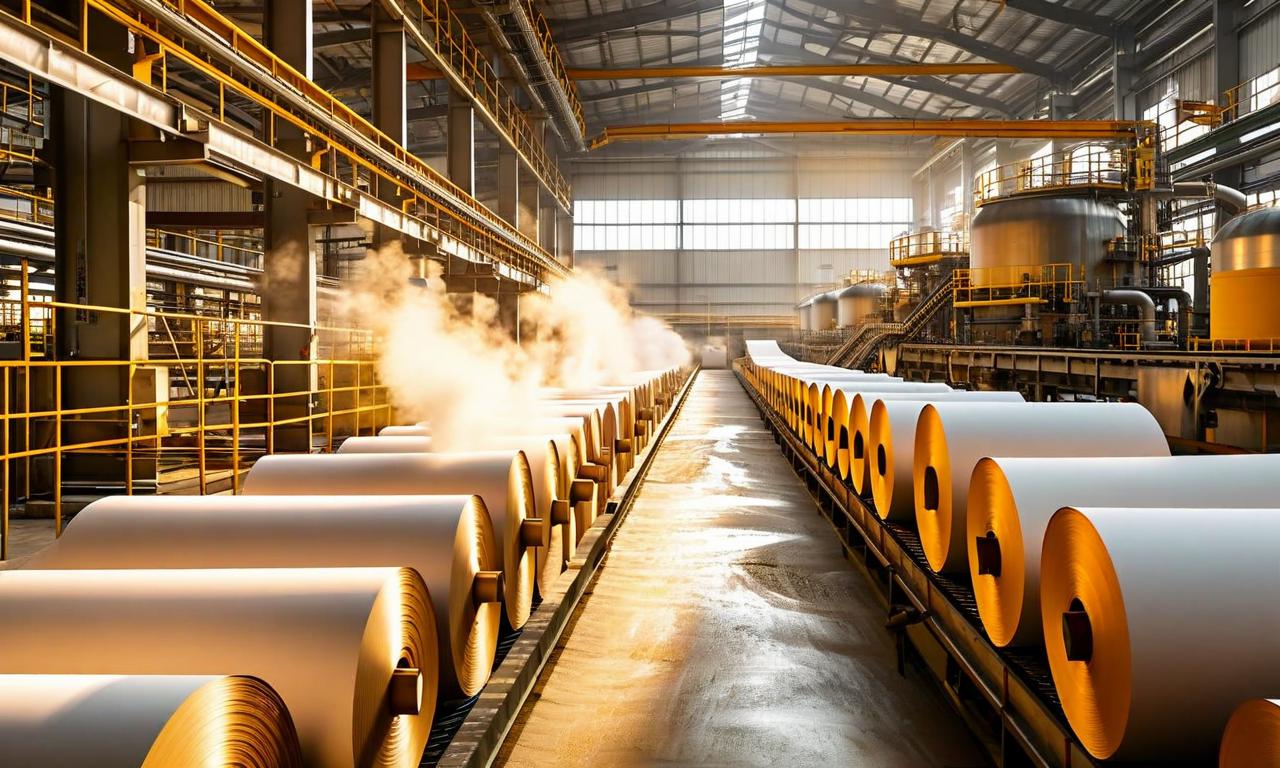
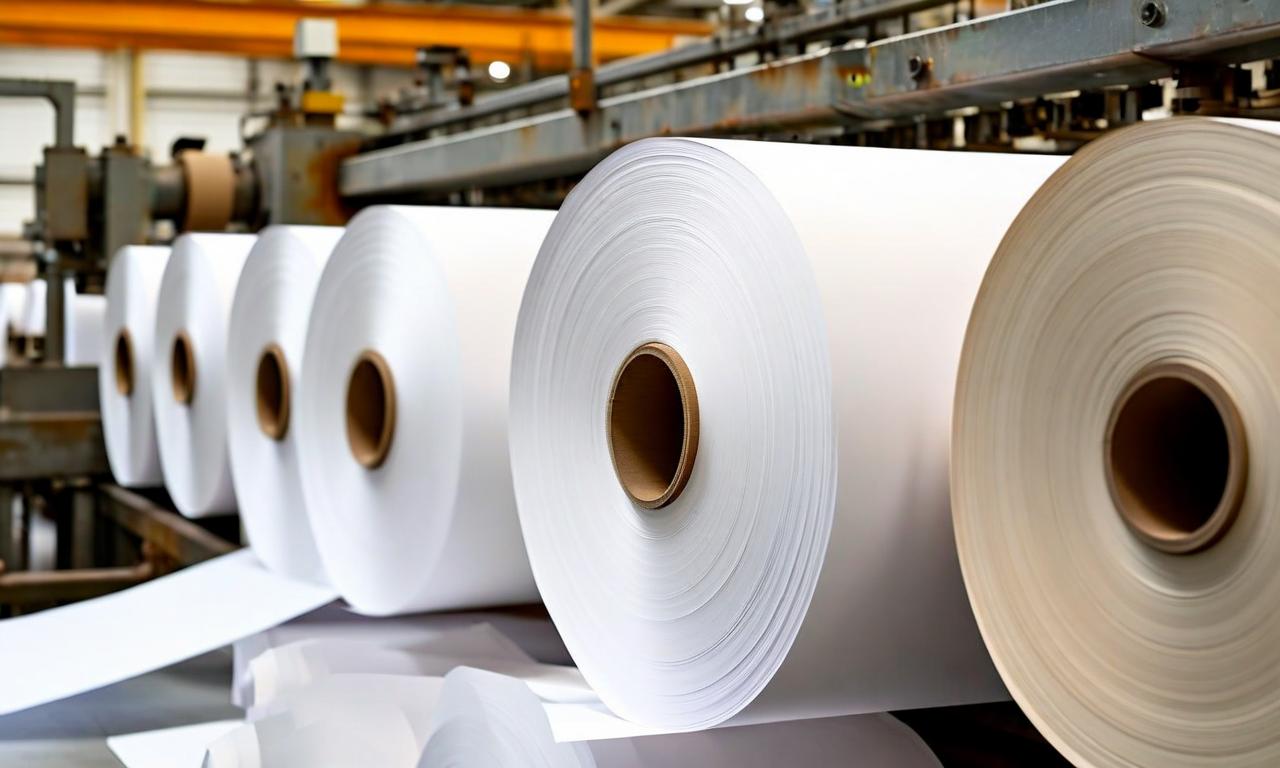
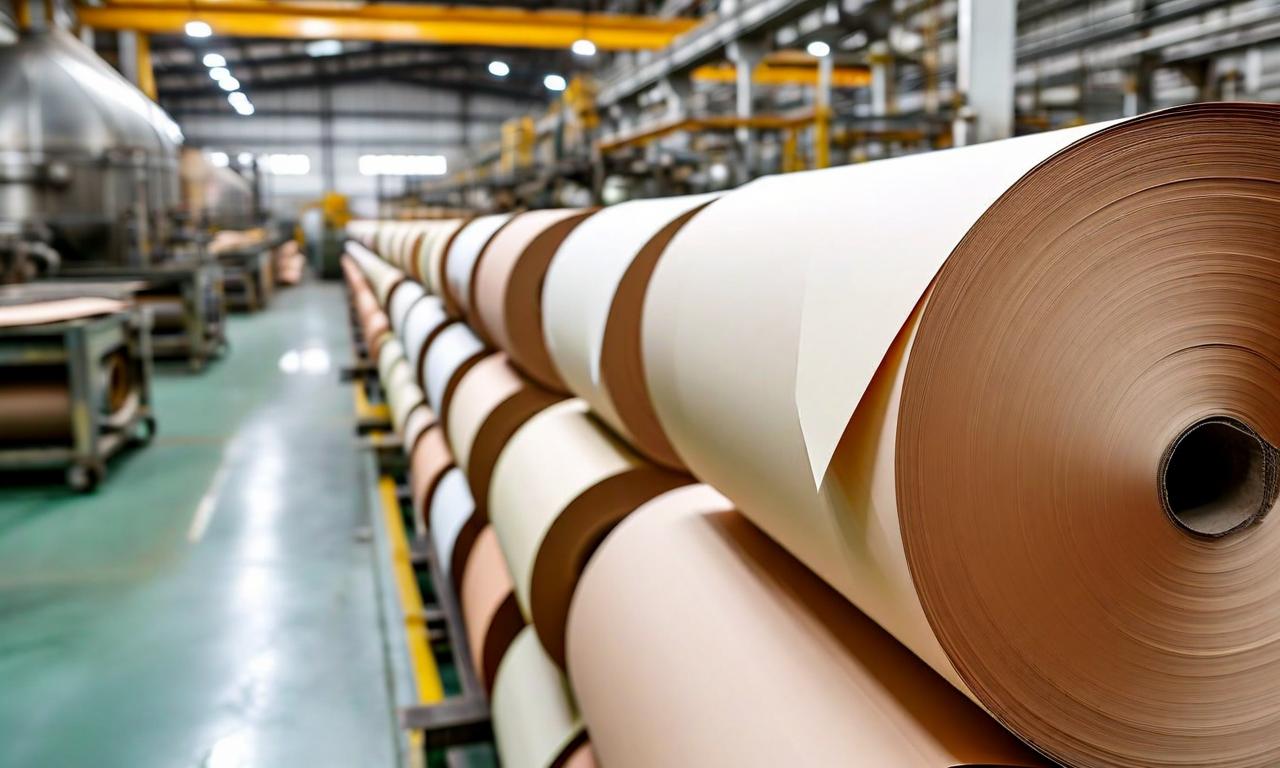
*this image is generated using AI for illustrative purposes only.
Satia Industries Limited announced its unaudited financial results for the quarter ended December 31, 2025, demonstrating a strong recovery in profitability during Q3FY26. The Punjab-based paper manufacturer reported significant improvements across key financial metrics, with the cogeneration division leading the performance turnaround.
Financial Performance Overview
The company's financial performance for Q3FY26 showed marked improvement compared to the previous quarter and year-over-year growth in profitability:
| Metric | Q3FY26 | Q2FY26 | Q3FY25 | Change (YoY) |
|---|---|---|---|---|
| Revenue from Operations | ₹38,030.81 lakhs | ₹31,112.61 lakhs | ₹37,582.57 lakhs | +1.19% |
| Total Income | ₹40,895.47 lakhs | ₹32,050.09 lakhs | ₹38,182.56 lakhs | +7.11% |
| Net Profit | ₹2,803.00 lakhs | ₹(2,451.74) lakhs | ₹1,979.92 lakhs | +41.58% |
| Earnings Per Share | ₹2.80 | ₹(2.45) | ₹1.98 | +41.41% |
The company achieved a profit before tax of ₹2,630.55 lakhs in Q3FY26, a significant turnaround from the loss of ₹2,511.99 lakhs in the previous quarter. Other income contributed substantially at ₹2,864.66 lakhs, compared to ₹599.99 lakhs in Q3FY25.
Segment-wise Performance Analysis
Satia Industries operates through three primary business segments, with varying performance across divisions:
| Segment | Q3FY26 Revenue | Q3FY26 Results | Q3FY25 Results | Performance |
|---|---|---|---|---|
| Paper | ₹37,898.52 lakhs | ₹(654.44) lakhs | ₹(1,232.55) lakhs | Improved Loss |
| Cogeneration | ₹7,845.75 lakhs | ₹3,789.24 lakhs | ₹3,078.03 lakhs | +23.11% |
| Agriculture | ₹130.71 lakhs | ₹47.84 lakhs | ₹48.77 lakhs | -1.91% |
The cogeneration division emerged as the standout performer, generating segment results of ₹3,789.24 lakhs compared to ₹3,078.03 lakhs in Q3FY25. This division's strong performance offset losses in the paper segment, which reported a loss of ₹654.44 lakhs, though this represented an improvement from the ₹1,232.55 lakhs loss in the corresponding quarter last year.
Nine-Month Performance
For the nine months ended December 31, 2025, the company's performance reflected mixed results:
| Parameter | 9M FY26 | 9M FY25 | Change |
|---|---|---|---|
| Revenue from Operations | ₹1,06,235.48 lakhs | ₹1,11,531.52 lakhs | -4.75% |
| Net Profit | ₹3,511.57 lakhs | ₹8,319.46 lakhs | -57.78% |
| Total Comprehensive Income | ₹3,413.55 lakhs | ₹8,312.65 lakhs | -58.94% |
The nine-month results showed revenue decline and reduced profitability compared to the previous year, indicating challenges faced during the initial quarters of FY26.
Balance Sheet Highlights
The company maintained a stable capital structure with paid-up equity share capital of ₹1,000 lakhs (10 crore shares of ₹1 each). Total segment assets increased to ₹1,62,514.27 lakhs from ₹1,48,844.64 lakhs in the previous year, while segment liabilities rose to ₹54,428.62 lakhs from ₹47,502.75 lakhs.
Corporate Governance
The Board of Directors, in their meeting held on February 12, 2026, considered and approved the unaudited financial results. The results were reviewed by the Audit Committee and subjected to limited review by the statutory auditors N Kumar Chhabra and Co., Chartered Accountants. The company operates with ISO 9001, 14001, and OHSAS 18001 certifications, manufacturing quality writing, printing, and specialty paper with ECO MARK certification from its facility in Punjab.
Historical Stock Returns for Satia Industries
| 1 Day | 5 Days | 1 Month | 6 Months | 1 Year | 5 Years |
|---|---|---|---|---|---|
| +1.64% | +7.28% | +4.45% | -4.74% | -33.40% | -44.52% |
 20
20