

SANY Heavy Industry H1FY26 Results: Revenue rises 19.5% to USD 7.89 billion


- H1 2026 revenue rose 19.49% YoY to USD 7.89 billion; net profit up 9.13% to USD 838.9 million
- Overseas revenue hit USD 4.72 billion (61.33% of core biz), led by 47.66% growth in Africa
- Q2 revenue accelerated 24.39% to USD 4.33 billion, exceeding H1 growth pace
- Piling machinery surged 63.11%, while excavation machinery remained largest segment at USD 3.14 billion
- Operating cash flow totaled USD 1.44 billion; total assets stood at USD 26.71 billion

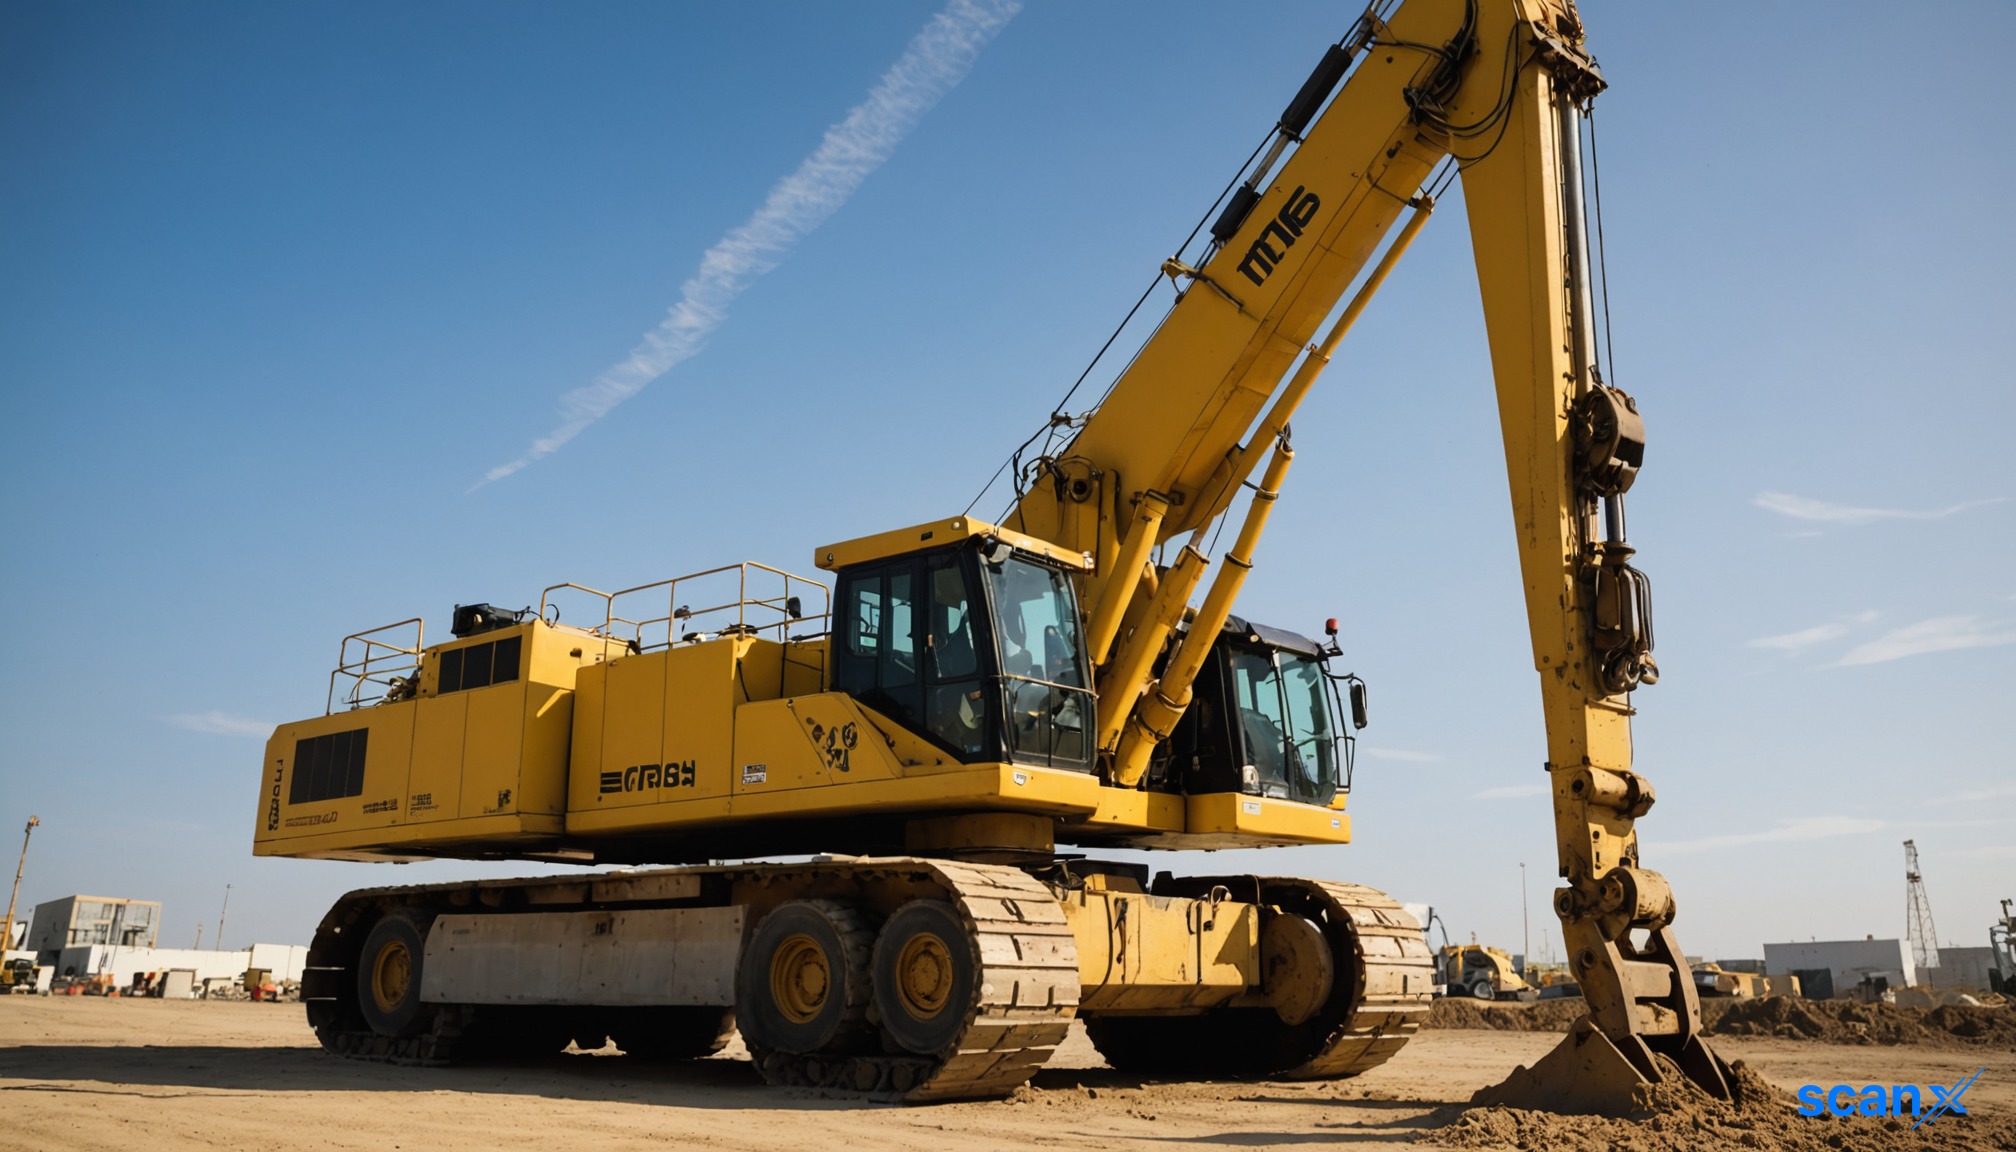

*this image is generated using AI for illustrative purposes only.
SANY Heavy Industry (600031.SH) reported H1 2026 revenue of USD 7.89 billion, a 19.49% year-over-year increase. Attributable net profit rose 9.13% to USD 838.887 million for the six months ended June 30, 2026.
The Chinese construction machinery manufacturer saw accelerated growth in the second quarter, with Q2 revenue jumping 24.39% to USD 4.328 billion. This outpaced the H1 growth rate, indicating stronger momentum in the latter half of the period. Operating cash flow stood at USD 1.440 billion.
Overseas Expansion Drives Growth
International markets remained the primary growth engine. Overseas revenue reached USD 4.724 billion, up 21.82% YoY and accounting for 61.33% of core business revenue. Africa led regional growth with a 47.66% surge to USD 790.234 million. The Americas grew 24.70% to USD 930.294 million, while Asia and Australia rose 17.38% to USD 1.981 billion. Europe posted a 12.68% increase to USD 1.022 billion.
| Region | Revenue (USD) | YoY Growth |
|---|---|---|
| Asia & Australia | 1.981 billion | 17.38% |
| Americas | 930.294 million | 24.70% |
| Europe | 1.022 billion | 12.68% |
| Africa | 790.234 million | 47.66% |
Product Line Performance
All major product categories recorded revenue growth. Excavation machinery remained the largest contributor at USD 3.141 billion (up 21.77%). Concrete machinery rose 21.25% to USD 1.330 billion. Piling machinery surged 63.11% to USD 322.433 million, showing the strongest momentum among key segments. Lifting machinery grew 8.22% to USD 1.245 billion, while road machinery increased 5.52% to USD 335.850 million.
What the Numbers Show
Profitability expansion lagged top-line growth significantly. While H1 revenue grew 19.49%, attributable net profit rose only 9.13%. This divergence suggests margin compression or higher operational costs associated with rapid international expansion and product mix shifts toward lower-margin segments like piling machinery, which grew fastest but represents a smaller share of total revenue compared to excavation equipment.
Balance Sheet Position
As of June 30, 2026, total assets stood at USD 26.708 billion, with shareholders' equity at USD 13.576 billion. The company maintains a solid equity base relative to its asset size, supporting its strategy of localized industrial operations overseas rather than pure product exports.

How will SANY Heavy Industry address the margin compression evident in the divergence between revenue and net profit growth?
What specific strategies is SANY employing to sustain its rapid 47.66% revenue growth in Africa amidst potential geopolitical or economic volatility?
Will the company's shift toward localized overseas industrial operations impact its short-term capital expenditure requirements and return on invested capital?
 18
18





 Access Market Heat-map & Insights
  Create, Save & Share your Screener
  Use 200+ Screening Filters





