

Sambhv Steel Tubes profit surges 70% in Q1FY27 as capex advances


Sambhv Steel Tubes Limited delivered strong Q1FY27 results with net profit rising 70% YoY to ₹566.12 million on robust revenue growth. The investor presentation highlighted significant progress in capacity expansion, with key machinery ordered and civil work advancing across Hot Rolling, Cold Rolling, and Power Plant divisions.


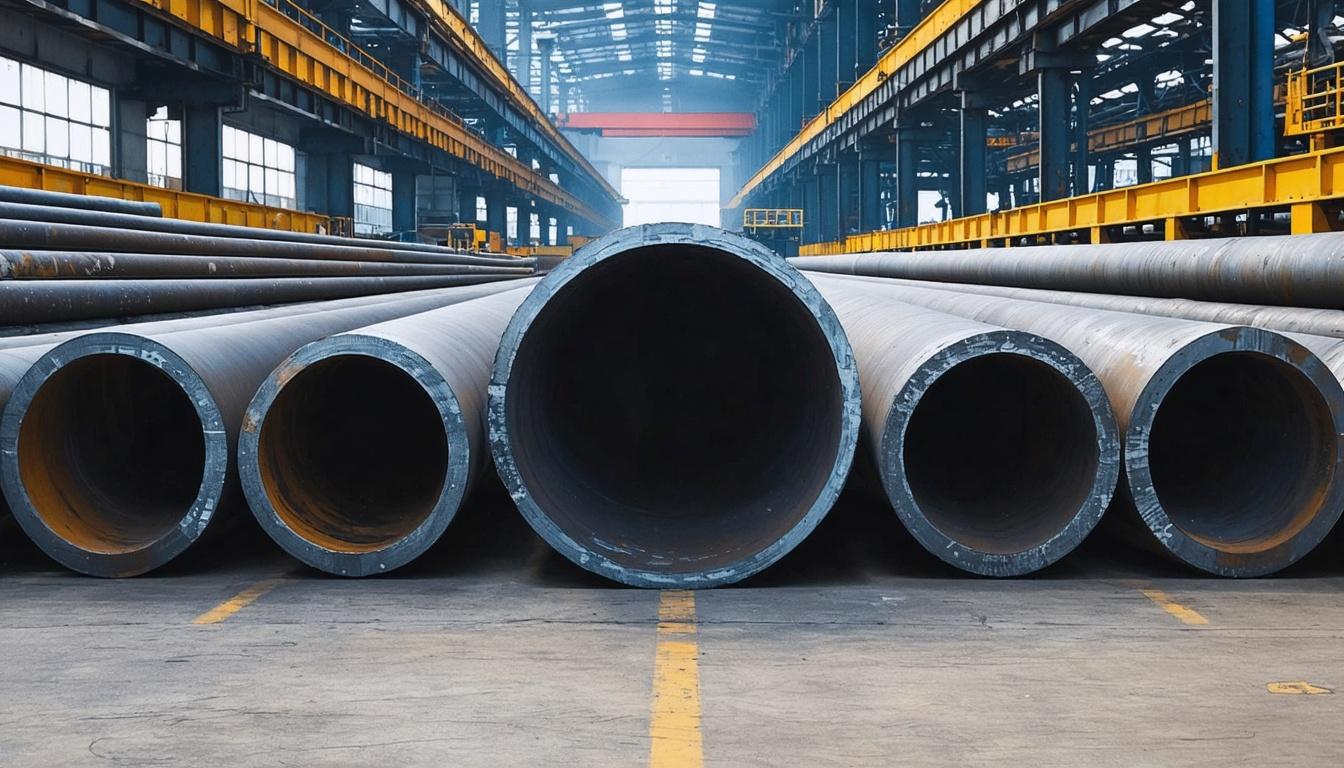
*this image is generated using AI for illustrative purposes only.
Sambhv Steel Tubes Limited reported a standalone net profit of ₹566.12 million for the quarter ended June 30, 2026 (Q1FY27), marking a 69.50% year-on-year increase from ₹333.99 million in Q1FY25. Consolidated net profit rose to ₹565.23 million, up from ₹338.71 million in the corresponding period of the previous fiscal year. Revenue from operations grew to ₹7,321.73 million on a standalone basis, compared to ₹5,586.29 million in Q1FY25, reflecting stronger operational performance in the steel manufacturing segment. This top-line growth, combined with reduced finance costs due to debt repayment from IPO proceeds, drove the significant profitability improvement.
The Board of Directors, meeting on August 03, 2026, approved these unaudited financial results as recommended by the Audit Committee. Statutory Auditors S S Kothari Mehta & Co. LLP issued a limited review report on both standalone and consolidated figures, confirming compliance with Regulation 33 of the SEBI (Listing Obligations and Disclosure Requirements) Regulations, 2015. Managing Director Vikas Kumar Goyal signed off on the results, which were prepared in accordance with Indian Accounting Standards (Ind AS). Company Secretary Niraj Shrivastava filed the disclosure along with an investor presentation detailing ongoing capital expenditure projects.
Financial Performance
The following table summarises key standalone and consolidated financial metrics for Q1FY27 against Q1FY25:
| Particulars: | Standalone Q1FY27 (₹ mn) | Standalone Q1FY25 (₹ mn) | Consolidated Q1FY27 (₹ mn) | Consolidated Q1FY25 (₹ mn) |
|---|---|---|---|---|
| Revenue from Operations: | 7,321.73 | 5,586.29 | 7,321.73 | 5,586.29 |
| EBITDA: | 951.00 | 727.00 | — | — |
| EBITDA Margin (%): | 12.99 | 13.01 | — | — |
| Profit Before Tax: | 768.75 | 450.43 | 768.60 | 456.71 |
| Net Profit: | 566.12 | 333.99 | 565.23 | 338.71 |
| EPS - Basic (₹): | 1.92 | 1.39 | 1.92 | 1.41 |
Capital Expenditure Project Status
The investor presentation provided detailed updates on the company’s major capacity expansion initiatives, including the Hot Rolling Mill, Power Plant, and Cold Rolling Mill (Kuthrel Unit-II). Key milestones for these projects are outlined below:
| Division: | Key Activity: | Target Timeline: | Current Status: |
|---|---|---|---|
| Hot Rolling Mill: | Key Machineries Ordering: | Q4FY26: | Completed: |
| Hot Rolling Mill: | Civil Work for Technological Structure: | Q2FY27: | ~80% Completed: |
| Hot Rolling Mill: | Equipment Erection: | Q3FY27: | ~20% Completed: |
| Hot Rolling Mill: | Testing and Commissioning: | Q4FY27: | TBC: |
| Power Plant: | Key Machineries Ordering: | Q4FY26: | Completed: |
| Power Plant: | Civil Work for Technological Structure: | Q2FY27: | ~90% Completed: |
| Power Plant: | Equipment Erection: | Q3FY27: | ~30% Completed: |
| Power Plant: | Testing and Commissioning: | Q4FY27: | TBC: |
| Cold Rolling Mill (Kuthrel Unit-II): | Key Machineries Ordering: | Q4FY26: | Completed: |
| Cold Rolling Mill (Kuthrel Unit-II): | Civil Work for Technological Structure: | Q2FY27: | ~40% Completed: |
| Cold Rolling Mill (Kuthrel Unit-II): | Testing and Commissioning: | Q4FY27: | TBC: |
What the Numbers Show
The significant jump in net profit is primarily driven by top-line growth rather than margin expansion alone. While revenue increased year-on-year, cost of materials consumed rose proportionally to ₹5,292.75 million from ₹3,681.53 million. EBITDA margin remained broadly stable at 12.99% versus 13.01% in Q1FY25, indicating consistent operational efficiency despite higher input costs. Finance costs decreased to ₹107.21 million from ₹164.37 million in Q1FY25, indicating improved debt management following the full utilization of IPO proceeds. The Company utilized the entire ₹4,400 million raised from its IPO, with ₹3,900 million directed toward repaying outstanding borrowings, contributing to lower interest expenses.
Corporate Actions and Future Outlook
Beyond financial reporting, the Board sanctioned the setup of an 8MW Captive Behind-The-Meter Solar Power Plant at its Kuthrel manufacturing unit. The project, estimated at ₹250 million, aims to optimize power costs for manufacturing facilities. Implementation is scheduled in two phases: Phase I (up to 3.2 MW) in FY28 and Phase II (up to 4.8 MW) in FY29. Financing will be sourced through internal accruals, debt, or lease arrangements as deemed fit.
The Board appointed Bikash Agrawal (DIN: 09231728) as an Additional Director effective May 09, 2026. Consequently, Agrawal ceased to be a Senior Management Personnel (SMP), a change disclosed to maintain complete regulatory records under Regulation 16(1)(d). The Company confirmed that Agrawal is not debarred from holding office by any SEBI order. The Company also announced it will convene its 09th Annual General Meeting (AGM) on Thursday, September 10, 2026, via video conferencing or other audio-video means.
Historical Stock Returns for Sambhv Steel Tubes
| 1 Day | 5 Days | 1 Month | 6 Months | 1 Year | 5 Years |
|---|---|---|---|---|---|
| -2.09% | +2.04% | +26.72% | +78.50% | +48.17% | +65.44% |

How will the commissioning of the Hot Rolling Mill and Cold Rolling Mill (Kuthrel Unit-II) in Q4FY27 impact Sambhv Steel's revenue mix and gross margins in FY28?
Given the stable EBITDA margin despite rising material costs, what hedging strategies or long-term supplier contracts is the company employing to protect profitability against future steel price volatility?
Will the 8MW Captive Solar Power Plant significantly reduce the company's operational expenditure on energy, and how might this improve its competitive advantage in a power-intensive industry?
 15
15





 Create Custom Screeners
  Access 200+ Pre-built Filters
  Use 50+ Readymade Screener





