Saatvik Green Energy secures ₹190 crore solar module order

scanx
Reviewed by
Ritika DScanX News Team
Key Highlights
  • Saatvik Green Energy's subsidiary secures ₹190 crore solar module order
  • Deal execution scheduled by March 2027 from an IPP/EPC player
  • Total disclosed order book stands at ₹1,821.56 crore
  • OPM compressed to 6.45% in Q4FY26 amid rapid revenue growth
powered bylight_fuzz_icon
47997993

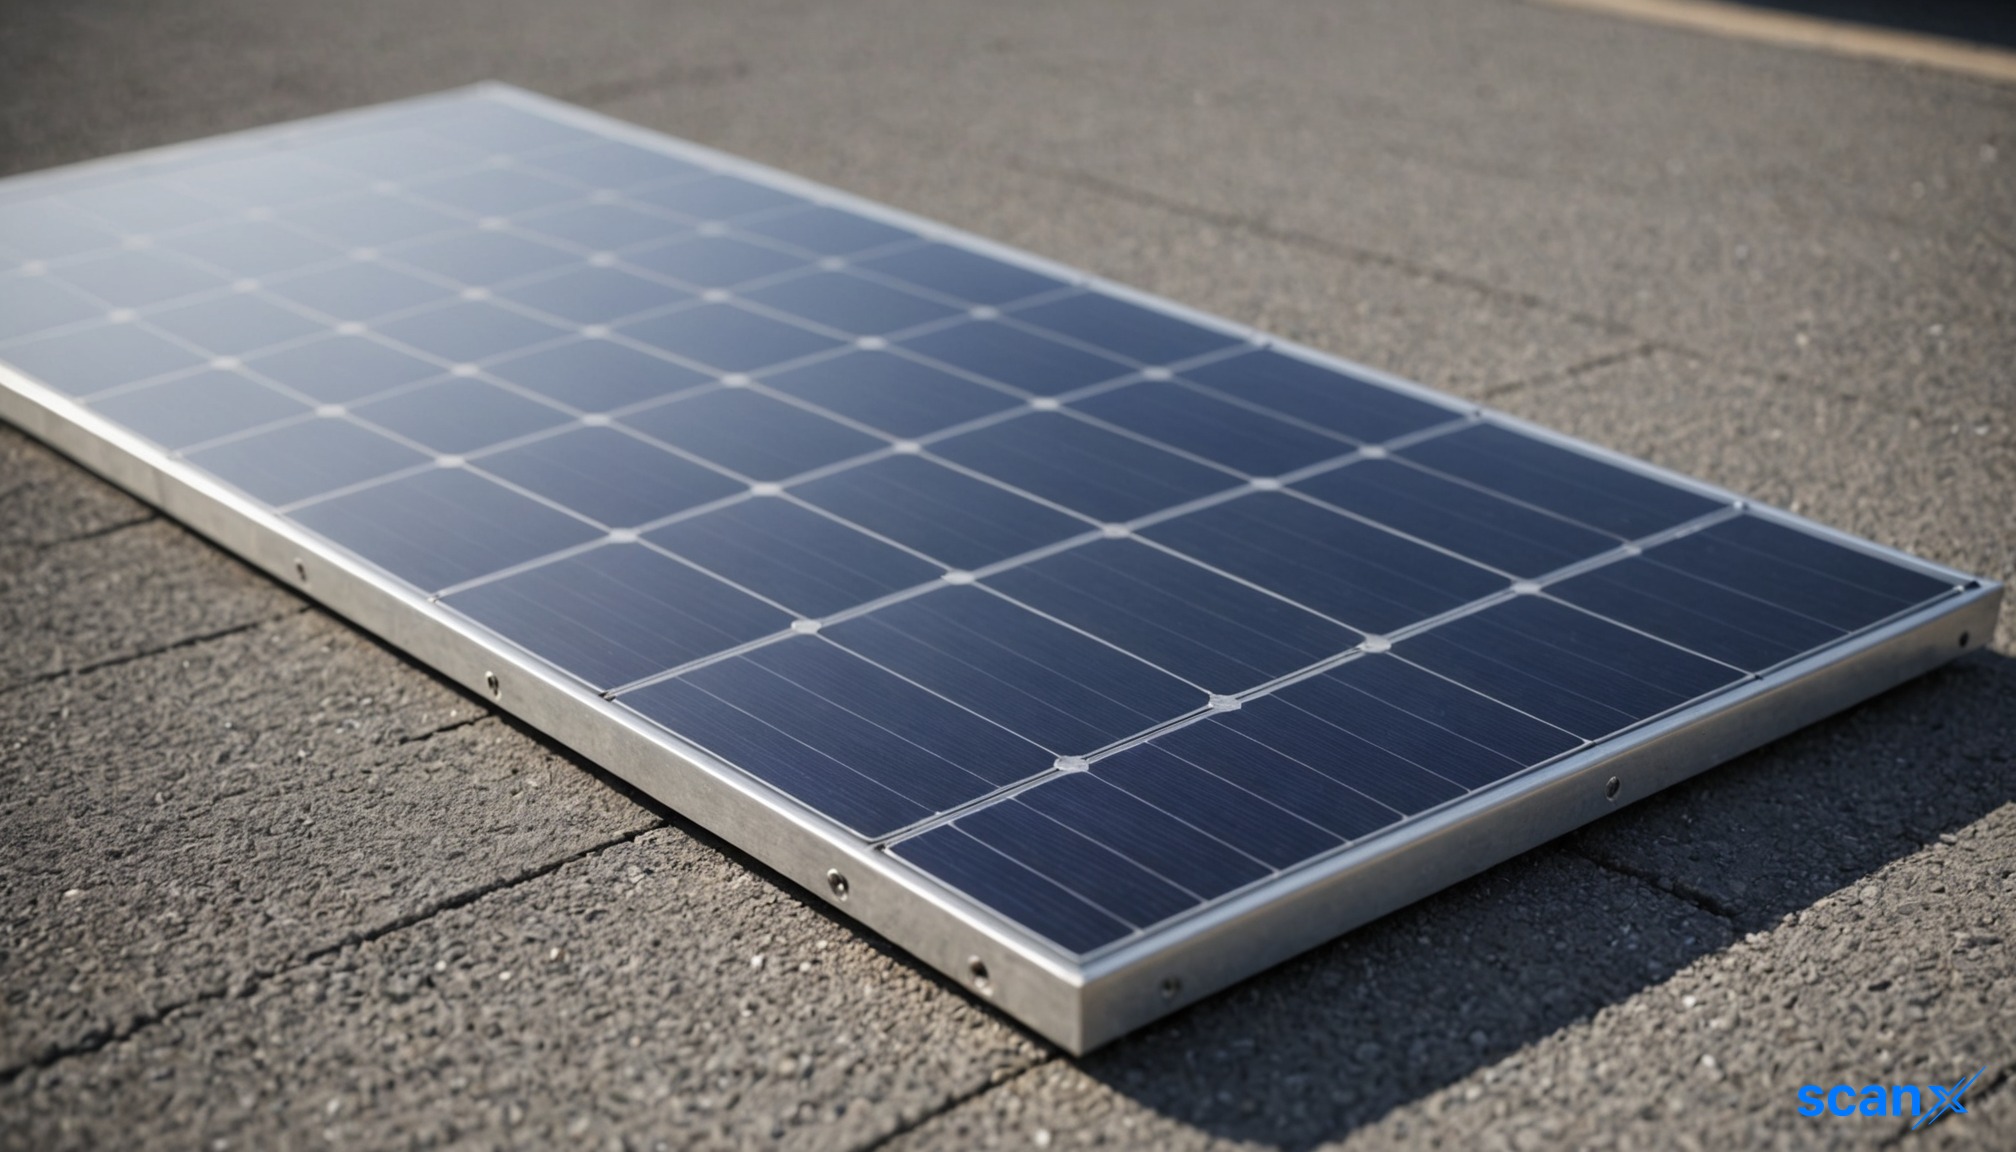
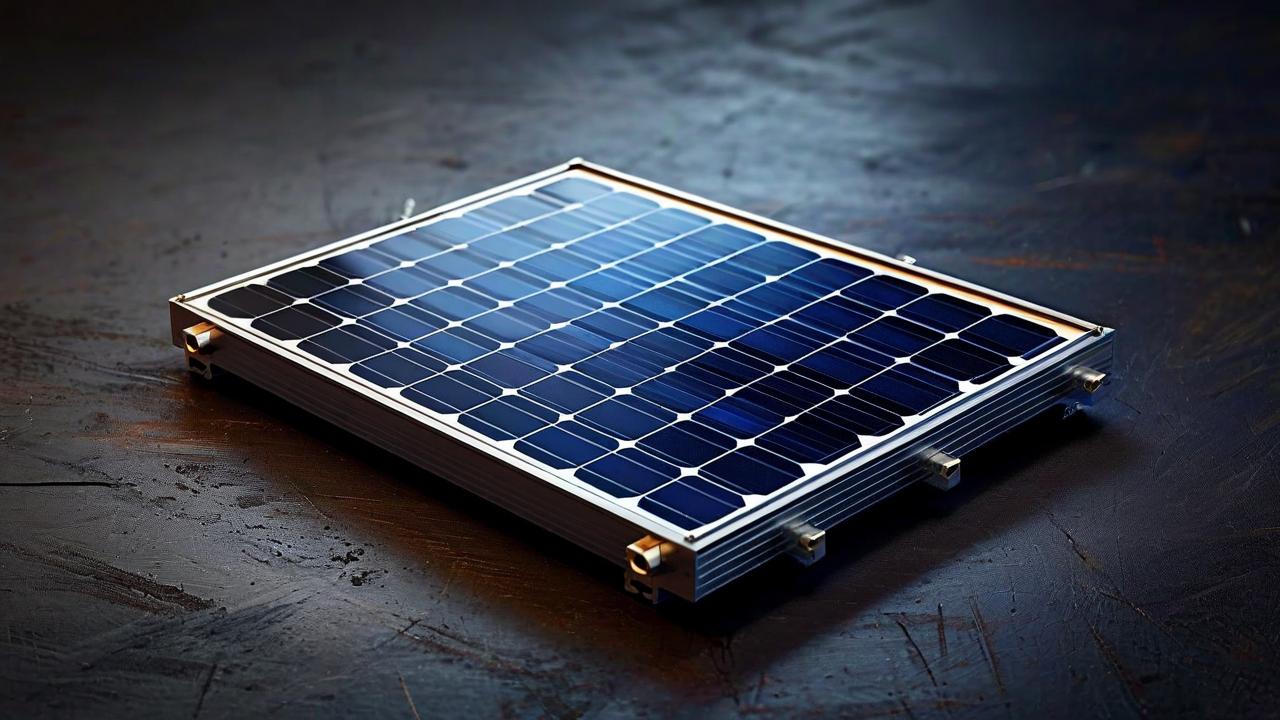
*this image is generated using AI for illustrative purposes only.

Saatvik Green Energy 's co-material subsidiary, Saatvik Solar Industries, has secured a confirmed work order valued at ₹190 crore from a renowned Independent Power Producer/EPC Player for the supply of Solar PV Modules. The company has committed to executing this order by March 2027. This filing confirms a firm contract rather than a preliminary selection or mobilisation notice.

Order in financial context

The ₹190 crore order represents approximately 18.15% of the company's average quarterly revenue of ₹1,047 crore. When combined with previous wins, the Total Disclosed Order Book (sum of the orders disclosed across the last 3 fiscal quarters shown in the table below) stands at ₹1,821.56 crore. This backlog provides coverage of approximately 1.74 quarters of average quarterly revenue. The improved book-to-bill ratio offers forward visibility compared to the previous position, though continuous order inflows remain necessary to sustain the high revenue run-rate.

Company order track record

Order inflow velocity has remained consistent in the most recent period with the addition of this new domestic order. In Q2FY27, the company reports total inflows of ₹1,336.16 crore across five orders, up from the previously reported ₹1,146.16 crore. Q1FY27 saw inflows of ₹485.40 crore across four orders. The company continues to secure contracts from both named entities like Vikran Engineering Limited and unnamed Independent Power Producers/EPC Players.

Quarter: Total order inflow (₹ crore): Key awarding entities:
Q2FY27 (Jul-Sep 2026) 1,336.16 (5 orders) Vikran Engineering Limited; renowned Independent Power Producer/EPC Player
Q1FY27 (Apr-Jun 2026) 485.40 (4 orders) Renowned Independent Power Producer/EPC Player

Execution and revenue quality

The company has demonstrated strong top-line growth but faces margin compression in recent quarters. Revenue rose from ₹783.20 crore in Q2FY26 to ₹1,616.60 crore in Q4FY26. However, Operating Profit Margin (OPM) declined from 14.11% in Q2FY26 to 6.45% in Q4FY26, despite net profit remaining positive. This signals potential pricing pressure or higher input costs as the company scales operations.

Quarter: Revenue (₹ crore): Net profit (₹ crore): OPM (%):
Q4FY26 1,616.60 60.40 6.45%
Q3FY26 1,268.50 96.90 12.02%
Q2FY26 783.20 83.20 14.11%

Revenue growth: order wins translating to revenue

As Saatvik Green Energy has accelerated order wins, with significant inflows in early 2026, its annual revenue has grown from ₹2,192.50 crore in FY25 to ₹4,548.44 crore in FY26, representing a YoY growth of +107.5% based on the latest annual data. This historical trend confirms that past order wins have successfully translated into substantial revenue expansion.

Working capital and execution capacity

The balance sheet indicates adequate short-term liquidity with a Current Ratio of 1.43x. Total Liabilities/Equity stands at 1.29x, reflecting a moderate leverage position that includes trade payables and other non-debt liabilities. However, cash conversion remains a concern; Operating Cash Flow was ₹42.60 crore in FY25 against capex of -₹187.10 crore, resulting in negative Free Cash Flow of -₹144.50 crore. This suggests that while the company is generating operating profits, heavy capital expenditure is consuming available cash, requiring careful working capital management to fund further expansion.

Key observations

  • Subsidiary execution: The ₹190 crore order is received by Saatvik Solar Industries, the co-material subsidiary of Saatvik Green Energy, underscoring its role as the primary contracting entity.
  • Margin stress: OPM declined from 14.11% in Q2FY26 to 6.45% in Q4FY26; execution efficiency or pricing power may be under pressure during rapid scaling.
  • Cash conversion: Free Cash Flow of -₹144.50 crore in FY25; backlog is not converting to surplus cash efficiently due to high capital expenditure requirements.
  • Backlog signal: Book-to-bill improved to 1.74x following the new disclosure. While better than the previous position, the company still relies on frequent large orders to maintain visibility given its high revenue scale.

Historical Stock Returns for Saatvik Green Energy

1 Day5 Days1 Month6 Months1 Year5 Years
-1.01%-1.33%-3.99%+13.44%0.0%0.0%

How will Saatvik Green Energy manage the significant working capital requirements for the ₹190 crore order given its history of negative free cash flow and high capex?

What specific operational strategies is the company implementing to reverse the sharp decline in Operating Profit Margin from 14.11% to 6.45% as it scales production?

Will the company need to raise additional equity or debt financing to sustain its current revenue run-rate and fund future capacity expansion?

Saatvik Green Energy Q1FY27 net profit falls 95% to ₹53.6 million

scanx
Reviewed by
Ashish TScanX News Team
Key Highlights

Saatvik Green Energy's Q1FY27 results reflect a challenging operating environment with net profit falling 95% YoY to ₹53.6 million and revenue declining 44% to ₹5,110.1 million. The company attributes the slowdown to geopolitical volatility, elevated input costs, and customer caution regarding ALMM regulations. However, management emphasizes a robust order book of 6.35 GW and imminent ramp-up of its Odisha cell manufacturing facility, targeting significant margin recovery in H2FY27 through backward integration and higher value-add DCR orders.

powered bylight_fuzz_icon
48258808

*this image is generated using AI for illustrative purposes only.

The Board of Directors of Saatvik Green Energy approved the unaudited standalone and consolidated financial results for the quarter ended June 30, 2026, in a meeting held on August 14, 2026. The company reported a significant contraction in profitability and operating margins compared to the prior year period, citing lower execution volumes, customer-led delays, and volatile commodity and logistics costs as primary drivers. Management highlighted that the company remained selective in order execution to preserve commercial economics, resulting in subdued sales but maintaining a strong forward order visibility of 6.35 gigawatts.

Consolidated Financial Performance

Consolidated revenue from operations stood at ₹5,110.1 million for the quarter, a decline of 44% from ₹9,157.3 million in the corresponding quarter of FY25. Total income was ₹5,197.3 million, including other income of ₹87.2 million.

Total expenses amounted to ₹5,123.2 million. Cost of materials and services consumed was ₹5,267.4 million, exceeding revenue from operations. This was partially offset by a decrease in inventories of finished goods and work-in-progress of ₹1,287.5 million. Employee benefits expense was ₹258.6 million, while finance costs rose to ₹217.4 million from ₹190.4 million in the prior year quarter.

Profit before tax was ₹74.1 million, compared to ₹1,461.8 million in Q1FY25. After tax expense of ₹20.4 million, the net profit for the period was ₹53.6 million, down from ₹1,166.0 million in the previous year. Basic earnings per share (EPS) were ₹0.43, compared to ₹10.41 in the same quarter last year.

EBITDA for the quarter was ₹338.0 million, down significantly from ₹1,800.0 million in Q1FY25. The EBITDA margin compressed to 6.61% from 19.34% in the corresponding period last year. Management noted that EBITDA on a pro-forma basis or adjusted for specific items stood at ₹425 million with an 8.33% margin, reflecting the impact of selective order execution and high input costs.

Metric Q1FY27 (Unaudited) Q1FY25 (Restated)
Revenue from Operations ₹5,110.1 million ₹9,157.3 million
EBITDA ₹338.0 million ₹1,800.0 million
EBITDA Margin 6.61% 19.34%
Profit Before Tax ₹74.1 million ₹1,461.8 million
Net Profit ₹53.6 million ₹1,166.0 million
Basic EPS ₹0.43 ₹10.41

Standalone Results

On a standalone basis, revenue from operations was ₹3,332.4 million, down from ₹3,778.0 million in Q1FY25. Standalone net profit fell 22% year-on-year to ₹68.6 million from ₹87.8 million. Standalone basic EPS was ₹0.54.

Operational Updates and Order Book

Production for the quarter stood at 408 megawatt, compared to 935 megawatt in Q4FY26 and 685 megawatt in Q1FY26. Sales stood at 334 megawatt, compared with 1,050 megawatt in Q4FY26 and 579 megawatt in Q1FY26. The moderation in volumes was attributed to customers adopting a wait-and-watch approach due to regulatory uncertainties surrounding ALMM-2 compliance and geopolitical tensions affecting input costs.

Despite the near-term slowdown, the company’s confirmed order book stands at approximately 6.35 gigawatts, valued at roughly ₹8,200 crores. This represents around 132% of the current operational module capacity of 4.8 gigawatt. Recent additions include a ₹138 crore domestic solar PV module order secured in July 2026 and an additional ₹400 crore order accepted by a subsidiary in August 2026. The order mix comprises approximately 70% utility-scale projects and 30% commercial and industrial (C&I) projects, with about 30% being Domestic Content Requirement (DCR) compliant orders.

Strategic Developments

The Odisha integrated manufacturing project remains on track for ramp-up. Phase 1, comprising 2.4 gigawatt of cell manufacturing and 4 gigawatt of module manufacturing capacity, has completed key utility and infrastructure milestones. Tool move-in and assembly activities are underway, with the ALMM-2 inspection planned for September 2026. Management expects full ramp-up to achieve 80% utilization by Q4FY27.

Phase 2, envisaging an additional 3.6 gigawatt of cell manufacturing capacity, is targeted to commence site activities by end-Q2FY27 and complete by end-FY28. Phase 3, focusing on 6 gigawatt of ingot and wafer manufacturing, is planned for completion in FY29. Additionally, the company acquired an 80% stake in Melcon Transformers and Electricals Private Limited for ₹24.0 million during the quarter, aiming to expand its ancillary business which currently contributes 4-5% of revenue, with a target to reach 15% in the coming years.

What the Numbers Show

The divergence between standalone and consolidated performance highlights the impact of subsidiaries on overall margins. While the standalone entity maintained a profit margin of approximately 2%, the consolidated group’s margin compressed significantly due to higher material costs in the broader group structure. Additionally, finance costs at the consolidated level increased 14% year-on-year to ₹217.4 million, suggesting rising interest burdens despite debt repayment initiatives funded by IPO proceeds. The sharp contraction in EBITDA margin from 19.34% to 6.61% underscores the pressure on operational efficiency amid declining revenues and selective order execution.

Accounting Policy Changes

The Group changed its accounting policy for inventory valuation from First In First Out (FIFO) to the moving weighted average cost method with effect from March 31, 2026. Comparative figures for the quarter ended June 30, 2025, have been restated accordingly. The change resulted in a decrease in profit before tax of ₹33.7 million for the restated prior year quarter.

Suresh Surana & Associates LLP served as the independent auditors for the review of the interim financial information.

Historical Stock Returns for Saatvik Green Energy

1 Day5 Days1 Month6 Months1 Year5 Years
-1.01%-1.33%-3.99%+13.44%0.0%0.0%

How will the successful ALMM-2 inspection of the Odisha Phase 1 plant in September 2026 impact Saatvik's ability to secure higher-margin domestic orders amidst current regulatory uncertainties?

Given the 44% revenue decline and compressed EBITDA margins, what specific cost-control measures or pricing strategies is management implementing to restore profitability in Q2FY27?

What is the projected timeline for the Melcon Transformers acquisition to contribute meaningfully to revenue, and how will it help diversify income away from volatile solar module cycles?

More News on Saatvik Green Energy

1 Year Returns:0.00%