

Steel Exchange India posts record rebar production of 69,617 MT in Q3FY26


- Recorded all-time high monthly rebar production of 25,095.035 MT in September 2026
- Achieved highest-ever quarterly production of 69,617.424 MT for Q3FY26
- September output surpassed previous monthly record of 24,823.509 MT set in August 2026
- Continuous Casting Machine contributed 17,677.655 MT to September's total output


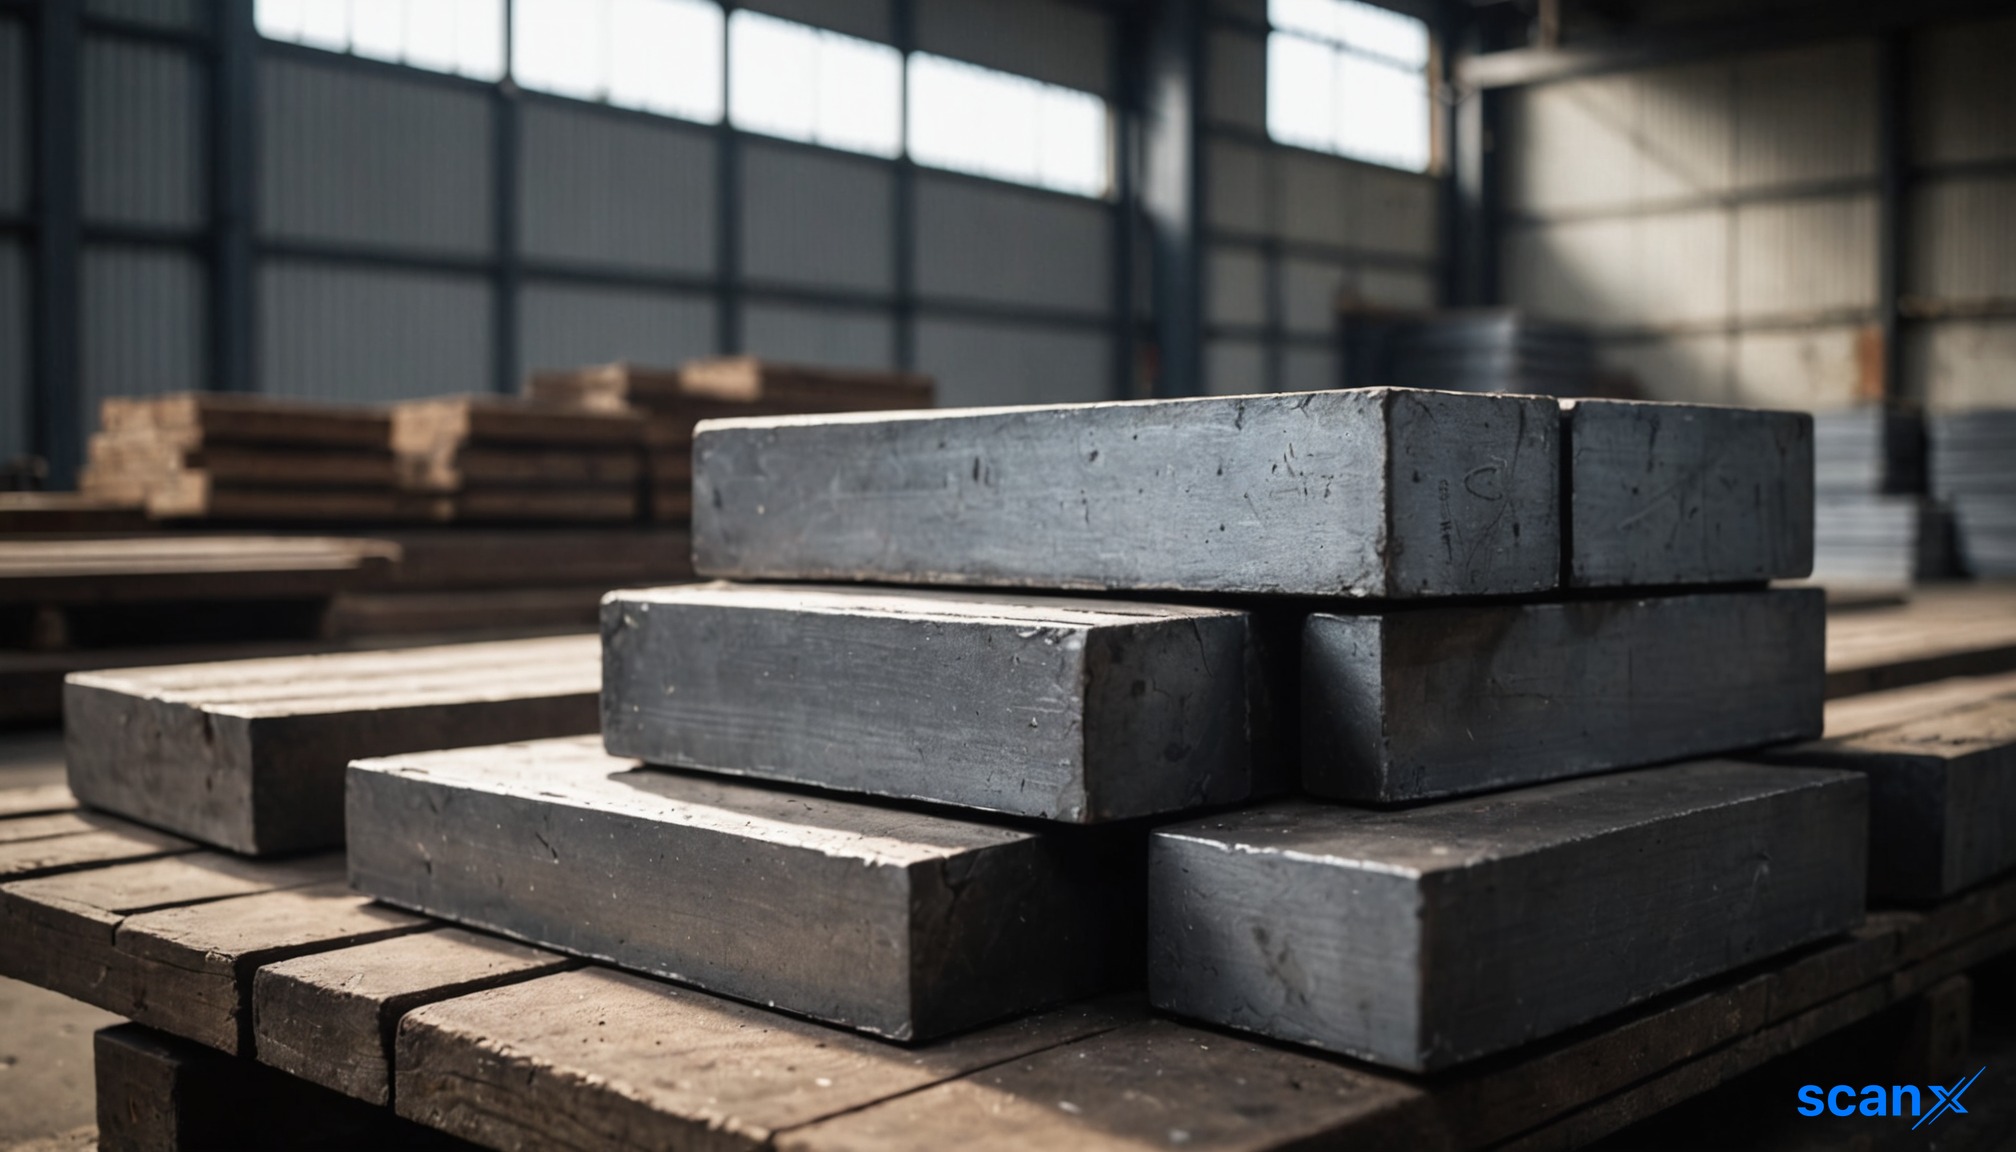
*this image is generated using AI for illustrative purposes only.
Steel Exchange India recorded all-time high rebar production of 25,095.035 MT in September 2026 and 69,617.424 MT for Q3FY26, marking peak performance on both a monthly and quarterly basis.
Record production milestones
The company achieved two simultaneous production records, with September 2026 representing the highest single-month output of re-bars and Q3FY26 marking the highest quarterly output in the company's history. The following table summarises the milestone figures:
| Period | Production (MT) | Record Type |
|---|---|---|
| September 2026 | 25,095.035 | All-time high monthly |
| Q3FY26 | 69,617.424 | All-time high quarterly |
The quarterly figure of 69,617.424 MT encompasses the cumulative re-bar output across the three months of Q3FY26, with September 2026 contributing 25,095.035 MT as the peak monthly volume within that period.
Monthly production breakdown
The new data reveals that the September 2026 output of 25,095.035 MT surpassed the previous highest monthly production of 24,823.509 MT recorded in August 2026. The month-wise production details for the July–September 2026 quarter are as follows:
| Month | Production (MT) |
|---|---|
| July | 19,698.880 |
| August | 24,823.509 |
| September | 25,095.035 |
| Total Q3FY26 | 69,617.424 |
Facility-wise output for September
For the month of September 2026, the production was split between the Continuous Casting Machine (CCM) and the Reheating Furnace (RHF). The CCM contributed 17,677.655 MT, while the RHF contributed 7,417.380 MT, summing up to the total record monthly production.
What the numbers show
The sequential growth from August (24,823.509 MT) to September (25,095.035 MT) indicates a marginal increase of approximately 1.1% MoM, sustaining the upward trajectory seen from July (19,698.880 MT). The significant jump from July to August suggests a ramp-up in capacity utilization early in the quarter, which was then maintained at higher levels in the subsequent months.
Historical Stock Returns for Steel Exchange India
| 1 Day | 5 Days | 1 Month | 6 Months | 1 Year | 5 Years |
|---|---|---|---|---|---|
| -0.18% | -2.01% | +6.06% | +46.79% | +9.06% | +51.56% |

How will the sustained high capacity utilization in Q3FY26 impact Steel Exchange India's operating leverage and EBITDA margins in the upcoming quarters?
What are the company's specific capacity expansion plans or capital expenditure allocations aimed at maintaining this production momentum beyond FY26?
How does the current rebar production surge align with the broader demand outlook for infrastructure and construction sectors in India for the next fiscal year?
 16
16







 Access 50+ Readymade Screeners
  Use 200+ Custom Filters
  Get Full Market Insights





