

Ratnaveer FY26 Net Profit Rises 37% to Rs 643.05 Mn; Q4 EBITDA Margin Expands to 11.37%


Ratnaveer Precision Engineering reported a 37% rise in FY26 net profit to Rs 643.05 Mn, with Q4 EBITDA margin expanding to 11.37% from 8.24% YoY. The board approved allotment of 34,31,446 equity shares to promoters on warrant conversion, and the company published its audited FY26 results advertisement in Financial Express on May 14, 2026.


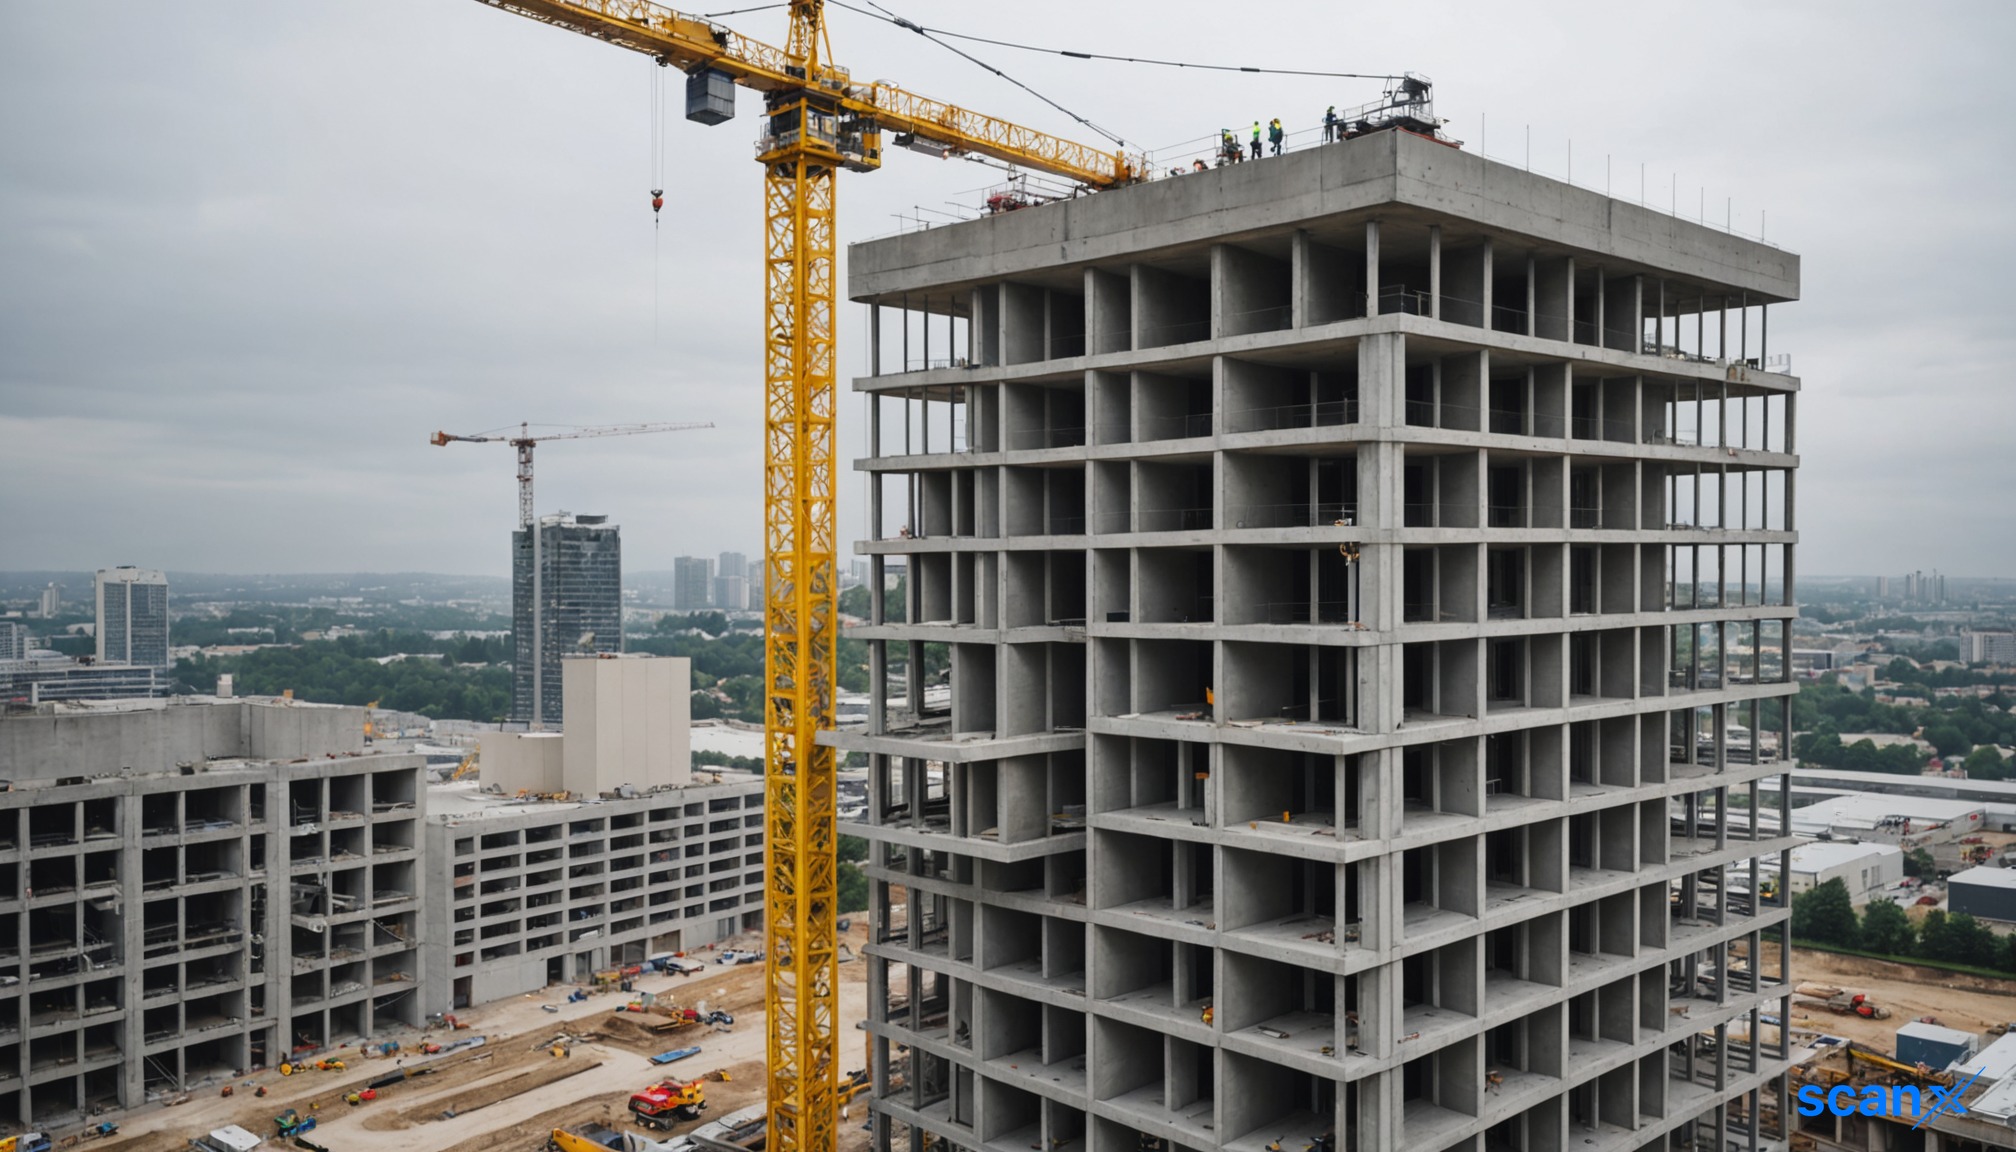
*this image is generated using AI for illustrative purposes only.
Ratnaveer Precision Engineering Limited held its Board of Directors meeting on May 12, 2026, wherein the board approved the Standalone and Consolidated Audited Financial Results for the quarter and financial year ended March 31, 2026. In addition to the financial results, the board also approved the allotment of 34,31,446 equity shares to promoters upon conversion of warrants. The meeting commenced at 03:00 PM (IST) and concluded at 05:30 PM (IST), with the filing made pursuant to Regulation 30 of the SEBI (Listing Obligations and Disclosure Requirements) Regulations, 2015. Separately, the company filed a declaration on May 12, 2026, pursuant to Regulation 33(3)(d) of the SEBI (LODR) Regulations, 2015, confirming that the statutory auditors, M/s. Pankaj R. Shah & Associates (FRN: 107361W), Ahmedabad, issued an unmodified audit opinion on the audited standalone and consolidated financial results for the quarter and financial year ended March 31, 2026. Subsequently, pursuant to Regulations 30 and 47 of the SEBI (LODR) Regulations, 2015, the company published a newspaper advertisement for its audited financial results in the Financial Express (both English and vernacular editions) on May 14, 2026.
Financial Performance: Q4 & FY26
Ratnaveer Precision Engineering reported a strong improvement in financial performance for both the quarter and the full year ended March 31, 2026. Q4 net profit rose to Rs 170.33 Mn from Rs 107.14 Mn in the same quarter of the previous year, while full-year net profit grew 37% to Rs 643.05 Mn. Q4 EBITDA rose to Rs 283 Mn from Rs 167 Mn year-on-year, with the EBITDA margin expanding significantly to 11.37% from 8.24% YoY, reflecting improved operational efficiency. The following table presents the key standalone (and consolidated, which are identical) financial highlights:
| Metric (Rs in Million): | Q4 FY26 (Audited) | Q3 FY26 (Unaudited) | Q4 FY25 (Audited) | FY26 (Audited) | FY25 (Audited) |
|---|---|---|---|---|---|
| Revenue from Operations: | 2,489.60 | 2,692.85 | 2,031.08 | 10,687.36 | 8,918.78 |
| Other Income: | 73.31 | 0.18 | 16.24 | 96.74 | 40.32 |
| Total Revenue: | 2,562.91 | 2,693.03 | 2,047.32 | 10,784.10 | 8,959.10 |
| Total Expenses: | 2,355.46 | 2,521.17 | 1,929.29 | 10,024.31 | 8,352.57 |
| EBITDA: | 283.00 | — | 167.00 | — | — |
| EBITDA Margin (%): | 11.37 | — | 8.24 | — | — |
| Profit Before Tax: | 207.45 | 171.86 | 118.03 | 759.79 | 606.53 |
| Net Profit (Continuing Operations): | 170.33 | 168.93 | 107.14 | 643.05 | 468.15 |
| Total Comprehensive Income (Owners): | 166.32 | 168.98 | 104.29 | 640.52 | 464.85 |
| Basic & Diluted EPS (Rs.): | 2.94 | 3.11 | 2.13 | 11.11 | 9.31 |
| Paid-up Equity Share Capital: | 681.90 | 680.65 | 532.44 | 681.90 | 532.44 |
| Other Equity: | 6,010.51 | 5,572.30 | 3,176.77 | 6,010.51 | 3,176.77 |
The audited financial results were reviewed and recommended by the Audit Committee and approved by the Board of Directors in their respective meetings held on May 12, 2026. The results were audited by M/s. Pankaj Shah & Associates, Chartered Accountants (Registration No.: 107361W), who issued an unmodified opinion stating that the financial results give a true and fair view in conformity with Indian Accounting Standards.
Segment-wise Performance
The company operates across domestic and international segments. The following table presents the segment-wise revenue and profitability:
| Segment (Rs in Million): | Q4 FY26 (Audited) | Q3 FY26 (Unaudited) | Q4 FY25 (Audited) | FY26 (Audited) | FY25 (Audited) |
|---|---|---|---|---|---|
| Domestic Revenue: | 2,391.00 | 2,594.55 | 1,916.90 | 10,132.72 | 8,419.66 |
| Outside India Revenue: | 98.60 | 98.30 | 114.18 | 554.64 | 499.12 |
| Total Segment Revenue: | 2,489.60 | 2,692.85 | 2,031.08 | 10,687.36 | 8,918.78 |
| Domestic Segment Profit (before Tax & Interest): | 287.84 | 223.48 | 118.45 | 964.68 | 733.31 |
| Total Segment Assets: | 12,616.11 | 12,474.70 | 7,462.62 | 12,616.11 | 7,462.61 |
| Total Segment Liabilities: | 5,923.71 | 6,220.62 | 3,753.41 | 5,923.71 | 3,753.44 |
Balance Sheet Highlights
The standalone balance sheet as at March 31, 2026, reflects a significant expansion in the company's asset base and equity position compared to the previous year. Key balance sheet metrics are presented below:
| Balance Sheet Item (Rs in Million): | As at 31-03-2026 | As at 31-03-2025 |
|---|---|---|
| Total Non-Current Assets: | 3,385.65 | 2,506.91 |
| Total Current Assets: | 9,230.47 | 4,955.71 |
| Total Assets: | 12,616.12 | 7,462.62 |
| Total Equity: | 6,692.41 | 3,709.21 |
| Total Non-Current Liabilities: | 538.26 | 475.46 |
| Total Current Liabilities: | 5,385.45 | 3,277.95 |
| Total Equity and Liabilities: | 12,616.12 | 7,462.62 |
Warrant Conversion and Promoter Share Allotment
The board also approved the allotment of equity shares on conversion of warrants to promoters on a preferential basis. A total of 34,31,446 warrants were converted into 34,31,446 equity shares at an issue price of ₹159.25/- per share (including a premium of ₹149.25/-). The aggregate amount received from allottees, representing the remaining 75% of the issue price per warrant, stood at ₹40,98,43,332/-. The details of the allotment are as follows:
| Allottee: | Category | Warrants Held (Prior) | Warrants Converted | Equity Shares Allotted | Amount Received (₹) | Warrants Pending |
|---|---|---|---|---|---|---|
| Mr. Vijay Sanghavi: | Promoter | 25,15,723 | 25,15,723 | 25,15,723 | 30,04,71,666 | Nil |
| Mrs. Seema Vijay Sanghavi: | Promoter Group | 25,15,723 | 9,15,723 | 9,15,723 | 10,93,71,666 | 16,00,000 |
Post conversion, the Issued, Subscribed and Paid-up Equity Share Capital of the company stands increased to ₹71,42,66,810/-, consisting of 7,14,26,681 fully paid-up equity shares of ₹10/- each. The new equity shares rank pari-passu with the existing equity shares of the company. The post-allotment shareholding of Vijay Ramanlal Sanghavi stands at 30,636,467 shares (42.89%), while Seema Vijay Sanghavi holds 1,853,283 shares (2.59%).
Cash Flow Summary
The standalone cash flow statement for the year ended March 31, 2026, reflects the following key movements:
| Cash Flow Item (Rs in Million): | FY26 | FY25 |
|---|---|---|
| Net Cash from Operating Activities: | (484.08) | 949.28 |
| Net Cash from Investing Activities: | (1,029.85) | (1,357.75) |
| Net Cash from Financing Activities: | 3,544.89 | 471.64 |
| Net Increase/(Decrease) in Cash and Bank Balance: | 2,030.96 | 63.17 |
| Closing Cash & Bank Balances: | 2,689.56 | 658.59 |
Upcoming Earnings Call
Following the board meeting, Ratnaveer Precision Engineering has scheduled a Q4 & FY26 investor-company connect earnings call on May 14, 2026, at 4:00 PM (IST), organized in association with FINPORTAL. The company has clarified that no Unpublished Price Sensitive Information (UPSI) is proposed to be shared during the meeting. The following representatives are scheduled to speak:
| Speaker: | Designation |
|---|---|
| Mr. Vijay Sanghavi: | Managing Director |
| Mr. Ajay Panchal: | General Manager Finance |
| Ms. CA Swati Jagtap: | Finance Analyst |
A copy of the latest presentation used in the meeting will be uploaded on the company's official website at www.ratnaveer.com . The Trading Window for dealing in the securities of Ratnaveer Precision Engineering Limited will continue to remain closed until the expiry of 48 hours after the declaration of the audited financial results for the quarter ended March 31, 2026. All filings were signed by Vijay Ramanlal Sanghavi, Managing Director & CFO (DIN: 00495922), and addressed to both the National Stock Exchange of India Limited and BSE Limited.
Historical Stock Returns for Ratnaveer Precision Engineering
| 1 Day | 5 Days | 1 Month | 6 Months | 1 Year | 5 Years |
|---|---|---|---|---|---|
| +4.42% | +3.49% | +18.40% | +116.87% | +125.83% | +165.09% |

With Mrs. Seema Vijay Sanghavi still holding 16,00,000 unconverted warrants, what is the timeline and likely market impact when these remaining warrants are converted into equity shares?
Given that operating cash flow turned sharply negative at Rs 484 Mn in FY26 despite strong profit growth, what working capital pressures or expansion-related factors could continue to strain cash generation in FY27?
With total assets nearly doubling year-over-year to Rs 12,616 Mn largely driven by current assets, how is Ratnaveer planning to deploy this expanded capital base to sustain its revenue and margin growth trajectory?
 20
20





 Create Custom Screeners
  Access 200+ Pre-built Filters
  Use 50+ Readymade Screener





